Dissipation Test
Overview
Dissipation tests may be analysed using the strain path method (SPM) proposed by Houlsby and Teh (1988). Further, dissipation tests carried out in over consolidated soils maybe corrected using the square root time method as proposed in Sully et al. (1999), and short tests may be extrapolated forward to estimate t_x
Horizontal coefficient of consolidation in ch is calculated using the method proposed by Houlsby and Teh (1988):
| c_h= \frac{T^*r^2 \sqrt{I_r}}{t} |
T^*
is the modified dimensionless time factor and depends on the degree of dissipation at time t. For 50% dissipation T^*
is 0.245.
Ir and r are rigidity index and penetrometer radius respectively. t is the time elapsed to reach to the desired dissipation degree (usually equals to t_{50})
Vertical coefficient of consolidation in c_vis calculated by dividing the c_h
by Ratio_ch_to_cv.
Procedure to analyse a dissipation test in normally consolidated soil
- Import the data as described in section Data Import.
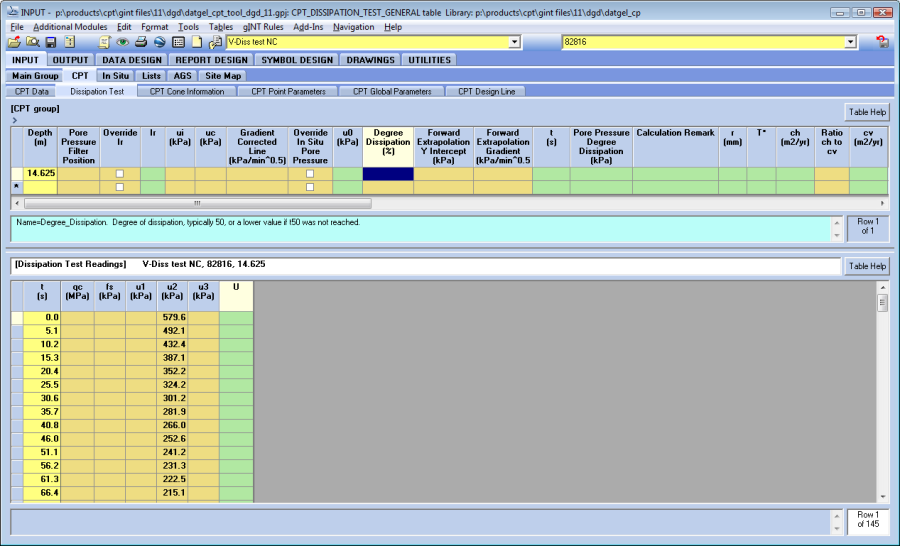
- Navigate to INPUT | CPT | Dissipation Test, and open the required PointID and Test Number. This example will use PointID 'V-Diss test NC', which is the same as the test at 14.625 m in data file Probedrill 01 2009.dis included in the CPT Tool package. After import the screen will look similar to the following screen shot.
- Ensure the ground water depth is defined, see section Groundwater. Set CPT_GENERAL.Groundwater_Depth to 1.50.
- Ensure a cone diameter of 37.5 mm is set in CPT_CONE_INFORMATION.Cone_Diameter for the Cone ID selected in CPT_GENERAL.Cone_ID.
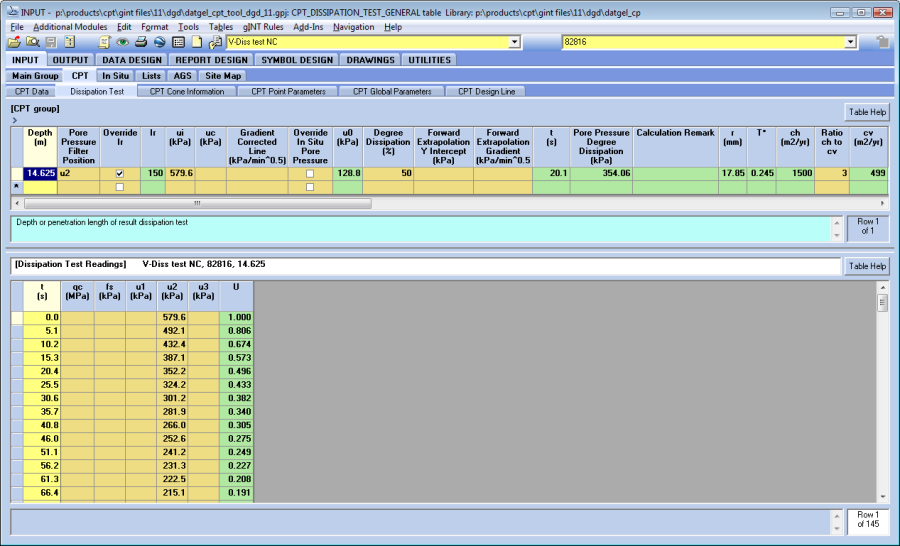
- In this example the Pore_Pressure_Filter_Position must be set to u_2.
- Rigidity_Index, I_r , maybe automatically looked up from CPT_DATA.Rigidity_Index_1 from the record with the same depth or next smaller depth, or may be manually defined by first checking the field Override_Rigidity_Index, Override I_r , and then entering a value. In this example you will manually define 150.
- Initial_Pore_Pressure, u_i, must be manually set, and is typically the first pore pressure reading of the test. In this example you will manually define 579.6.
- Corrected_Initial_Pore_Pressure from back-extrapolation, u_c, and Gradient_Corrected_Line, are not typically required for normally consolidated soils. In this example these two fields are left blank.
- In_Situ_Pore_Pressure is automatically calculated based on the groundwater depth (described in section Groundwater). By checking Override_In_Situ_Pore_Pressure, you can manually set u_0 . In this example you will allow u_0 to automatically calculate.
- Degree_Dissipation defines the degree of dissipation, typically 50, or a lower value if t_{50} was not reached. In this example you will use 50.
- Forward_Extraplolation_Y_Intercept and Forward_Extrapolation_Gradient can be used to define a best fit line to forward extrapolate to a tt beyond the recorded data when the test doesn't reach the required Degree Dissipation. In this example these two fields are left blank.
- Ratio_ch_to_cv is the ratio of horizontal coefficient of consolidation to vertical coefficient of consolidation. In this example you will use 3.
- Now click the Save button, and the recalculated screen should be similar to the following screen shot.
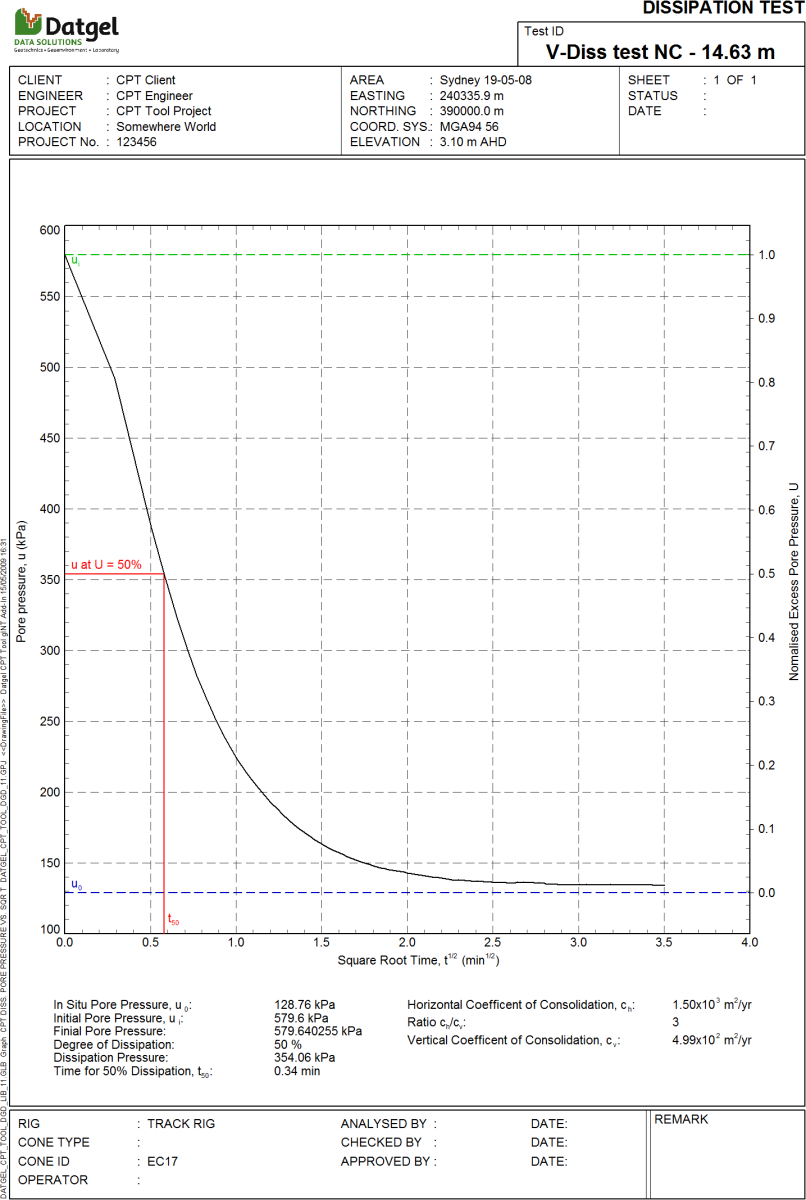
- To preview the graph report, click on the bottom half of the screen and the click the Preview icon. Graph!ppdt pore pressure vs. sqr t a4p should already be set as the default report for this table. The preview should be similar to the following figure.
Procedure to analyse a dissipation test in overconsolidated soil
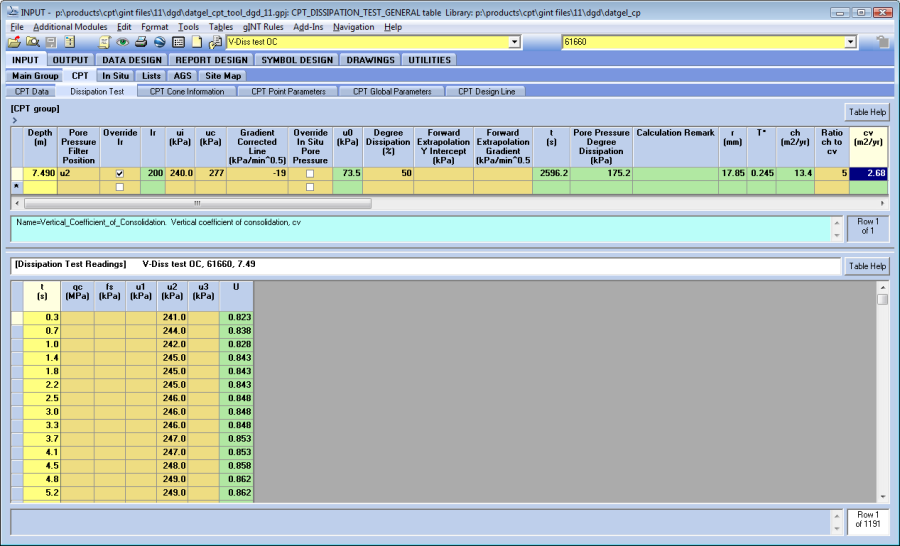
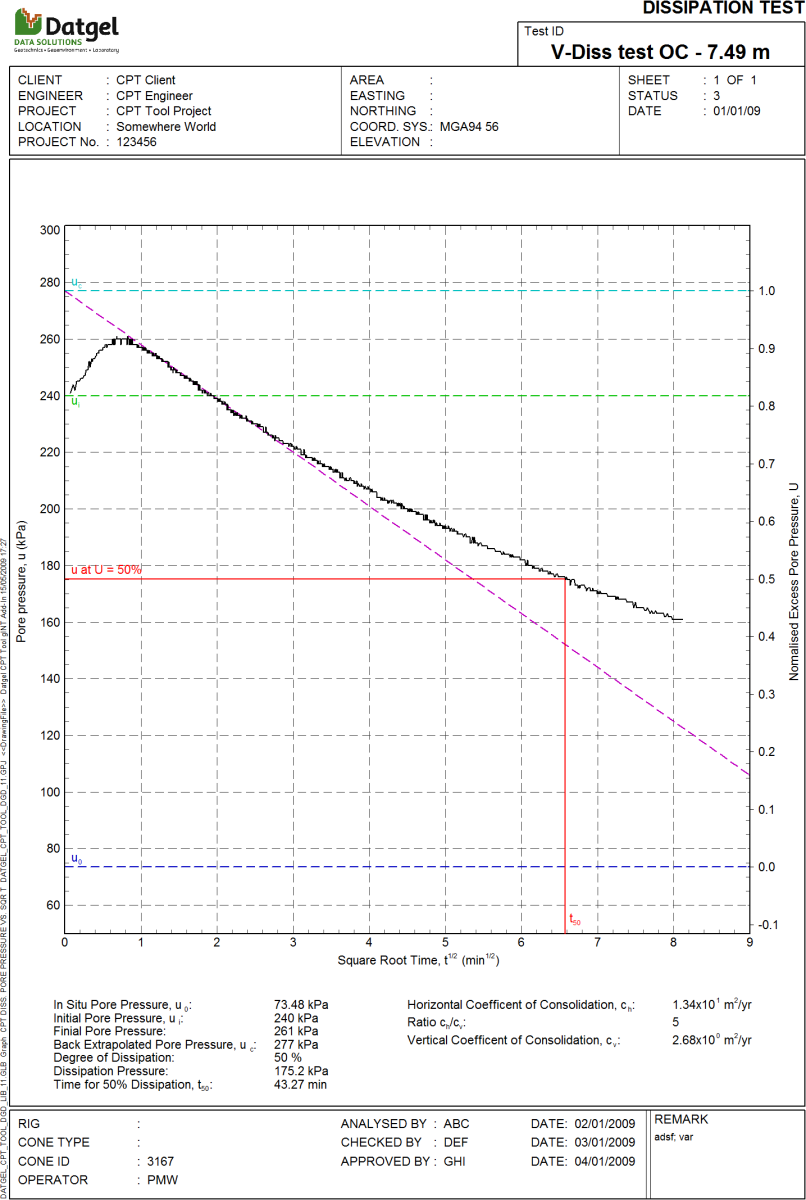
This example uses PointID V-Diss test OC, which corresponds with the data in file Geotech_AB_04.cpt and Geotech_AB_04.dpt included in the CPT Tool package.
- Follow steps 1 to 6 and 8 to 12 described above, however in this example set I_r to 200, u_i to 240.0, and Ratio ch to cv to 5.
- You may also like to use the minimum and maximum scale fields to control the graph report scale extents.
- As you can see in the following graph, the pore pressure first increases before decreasing. This is a typical Type III over consolidated response described in Sully et al 1999. The u_c
and Gradient Corrected Line must be correctly defined (see figure 7 in Sully et al 1999). The simplest procedure is to preview the Graph report ppdt pore pressure vs. sqr t a4p by clicking on the INPUT preview button , estimate uc and the gradient, close the preview and enter the estimated numbers in the fields. Repeat the procedure until you are happy with the magenta coloured line.
Procedure to use forward extrapolation
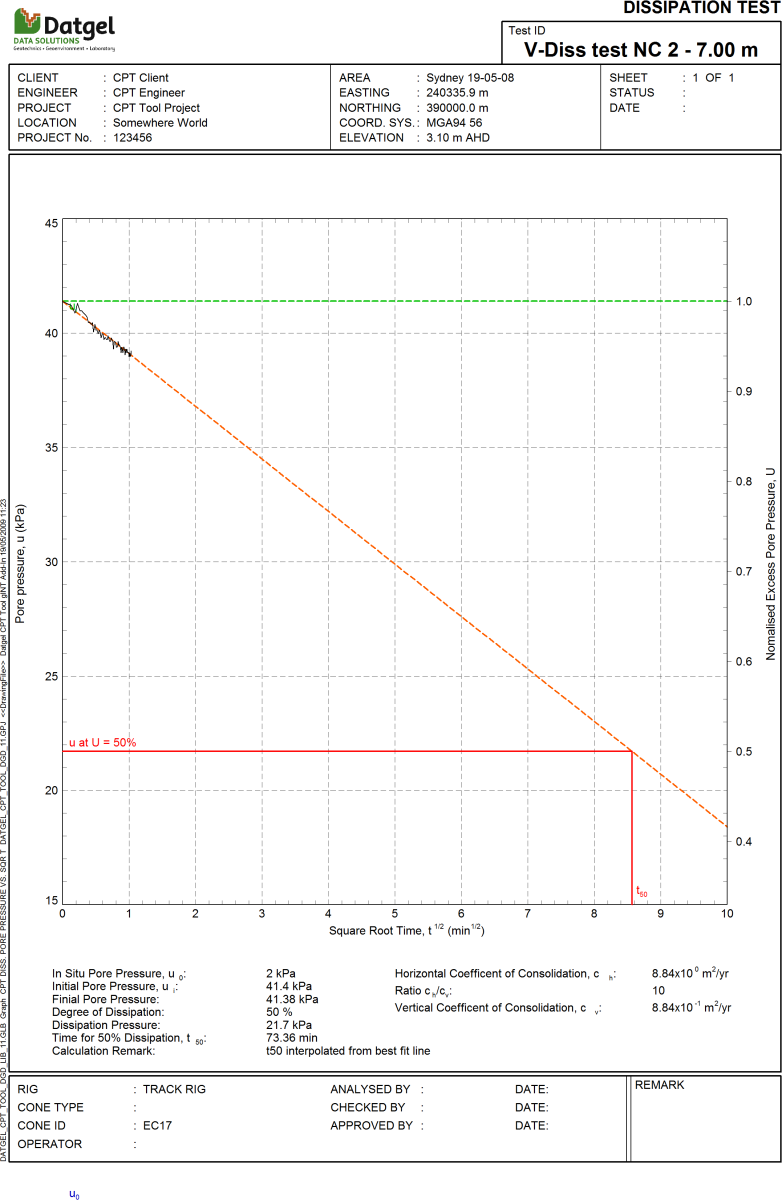
The forward extrapolation option allows you to define a straight line in measure pore pressure – square root minute space that will be used to estimate t_x
beyond the recorded data range. An example of it use is illustrated below.
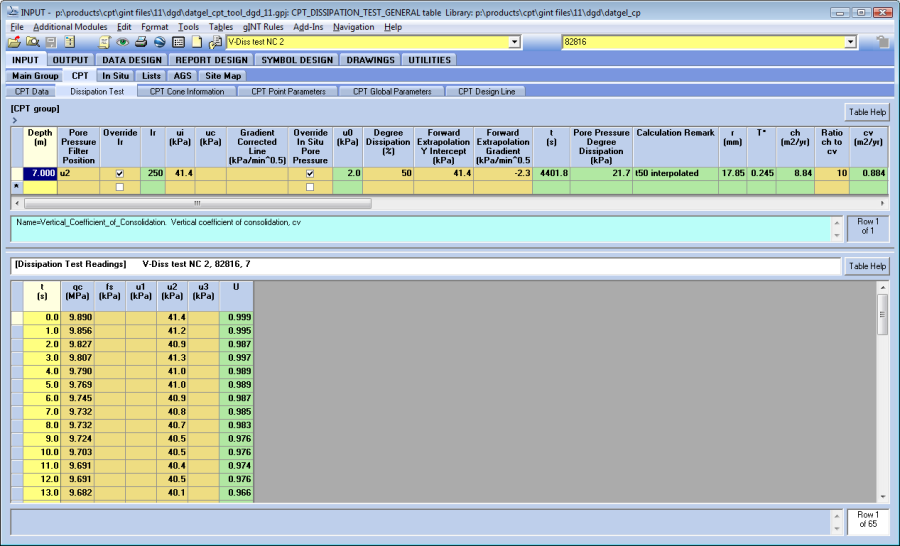
In this example, PointID = V-Diss test NC 2, the data was recorded for only 64 seconds which corresponds with 5.5% degree of dissipation. The forward extrapolation line can be used to estimate t50.
- Enter data in CPT_DISSIPATION_TEST_GENERAL as described in previous examples.
- The simplest procedure to define the Forward_Extraplolation_Y_Intercept and Forward_Extrapolation_Gradient fields is to preview the Graph report ppdt pore pressure vs. sqr t a4p by clicking on the INPUT preview button , estimate y intercept and gradient, close the preview and enter the estimated numbers in the fields. Repeat the procedure until you are happy with the orange coloured line. An alternative is to print the same report in output and manually define the line on paper and then enter the values in the fields.
