Group by Report
Aim
This example shows the batch output of a moisture content graph, a PSD graph and a non-cored log grouped by Report Name.
Procedure
- Select INPUT | Add-Ins > Datgel Output Tool > Datgel Output Tool to launch the tool.
- On the General tab in the Configuration Type region, check the Report bullet to group by report.

- On the General tab in the Output region, click on the
 button to launch a Windows Explorer window.
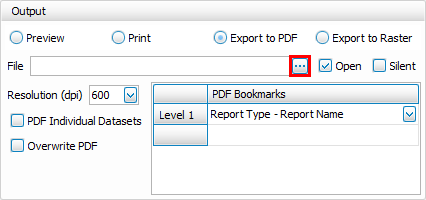
- In the Windows Explorer window, navigate to a folder that you want to save the PDF file to and enter the name that you want to call the file in the File Name field.
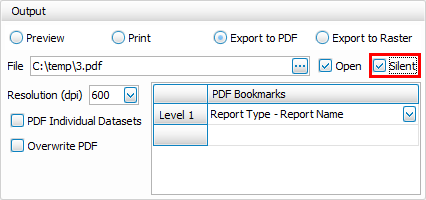
- Click on the Silent option to prevent the error report form from displaying at the end of the output run.
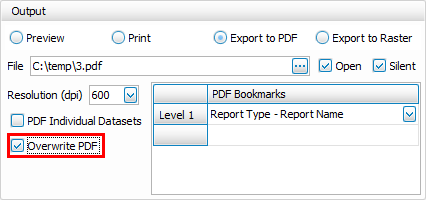
- Click on the Overwrite PDF option to overwrite the PDF file if it already exists.
- In the PDF Bookmarks area, click on the
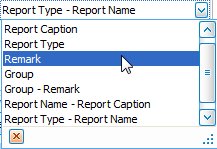
 button for the Level 1 bookmark to display the list of Bookmarks.
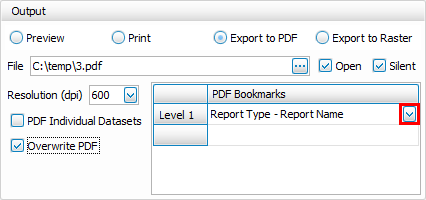
- Click on the Remark option to use this Bookmark type. This will result in the Reports grid remark field being used as the PDF bookmark
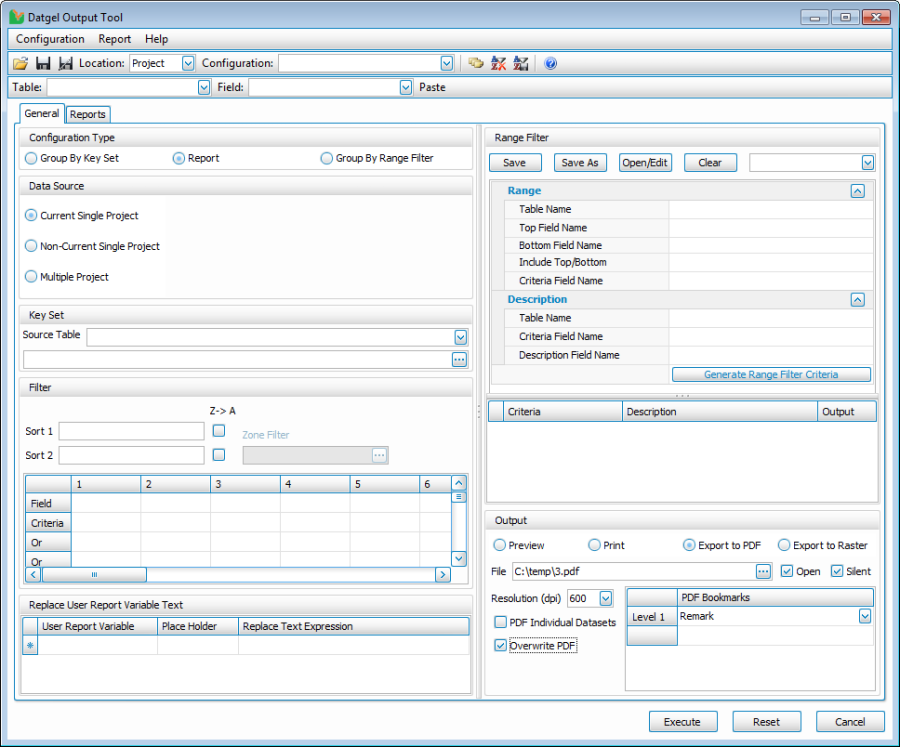
- Once completed, your screen should look similar to this:
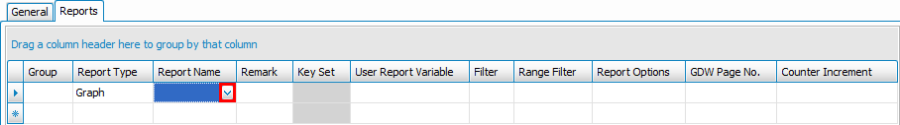
- Now go to the Reports tab.
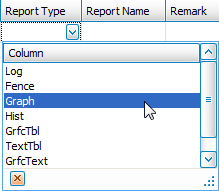
- In the Report Type column, click on the button to display a list of the available types of reports in the library file.
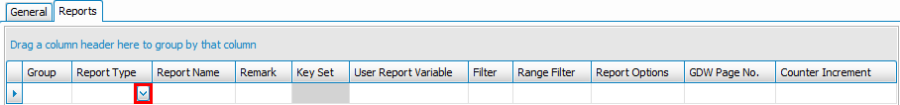
- Select the Graph report option.
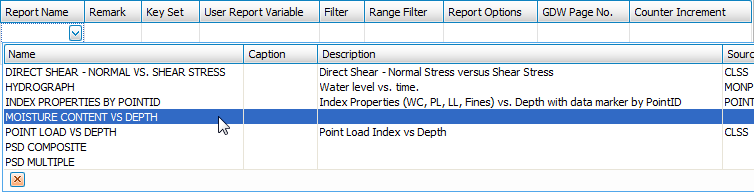
- In the Report Name column, click on the button to display a list of the available reports in the library file.
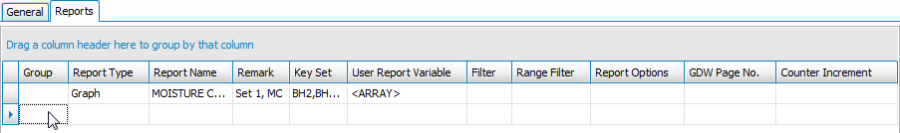
- Select the MOISTURE CONTENT VS DEPTH report.
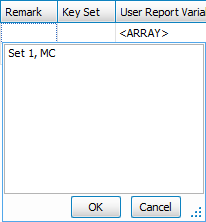
- In the Remark column on the row that contains the MOISTURE CONTENT VS DEPTH Graph report, you should enter the text Set 1, MC to assign the Remark bookmark value. The "," will create a bookmark node.
- In the Key Set column on the row that contains the MOISTURE CONTENT VS DEPTH Graph report, click on the button to display the Key Set Selector form.
- Select the Key Sets BH2, BH3, BH4, BH5, BH6. BH7, BH8 and BH9 from the Available Key Sets grid and then click the
 button to add them to the Selected Key Sets grid.
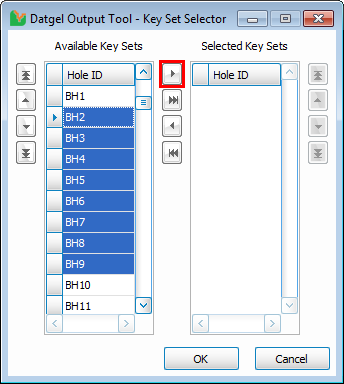
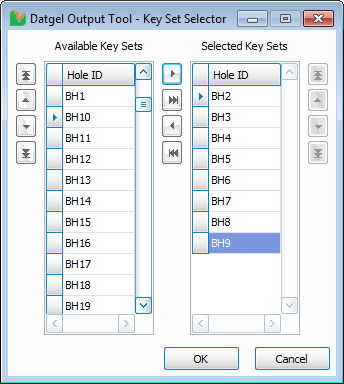
- Click OK to accept the Selected Key Sets.
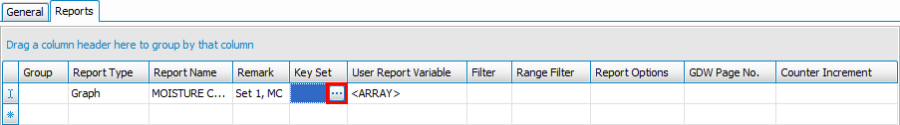
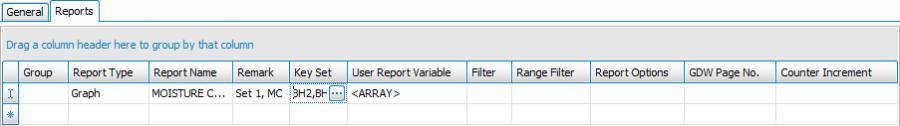
- At this stage your form should look similar to this:
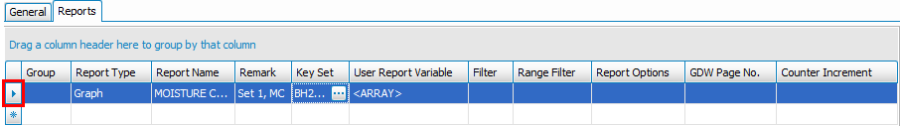
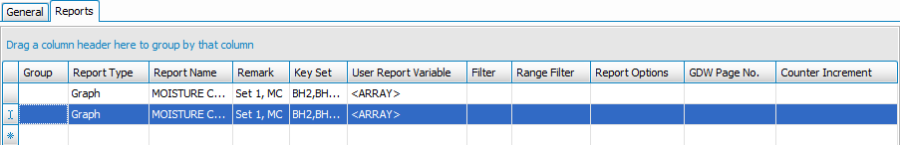
- We could now repeat Steps 11 through to 18 to add similar details for the PSD MULTIPLE Graph report. Instead, we can copy the details for the MOISTURE CONTENT VS DEPTH Graph report. To do this, left click on the row button to highlight the row.
- Copy the contents of the row (by using CTRL+C) and then move to the next empty row (by left clicking on it).
- Paste the contents into the next empty row (by using CTRL+V).
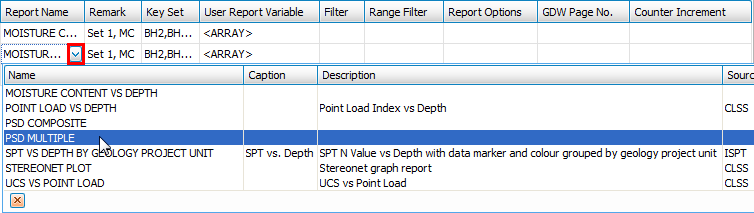
- In the Report Name column, click on the button and change the Report Name from MOISTURE CONTENT VS DEPTH to PSD MULTIPLE
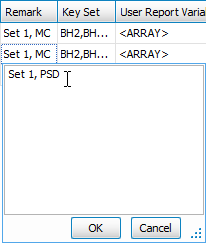
- In the Remark column, on the row that now contains the PSD MULTIPLE Graph report, you should change the text from Set 1, MC to Set 1, PSD and then click OK.
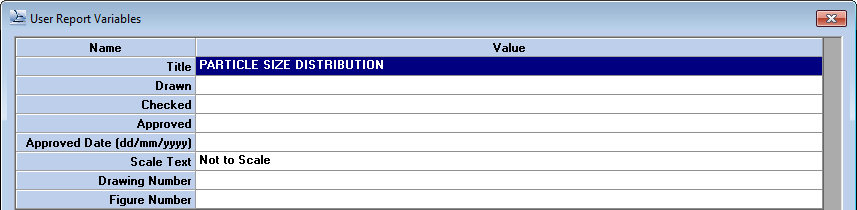
- If you want to edit the User Report Variables for the PSD MULTIPLE Graph report, click on the button in the User Report Variable column on the row that contains the PSD MULTIPLE Graph report.

- This will launch the gINT Output User Report Variables dialogue window and if you wish, you can enter the details you require. Click OK to accept the data you have entered or Cancel to discard them.
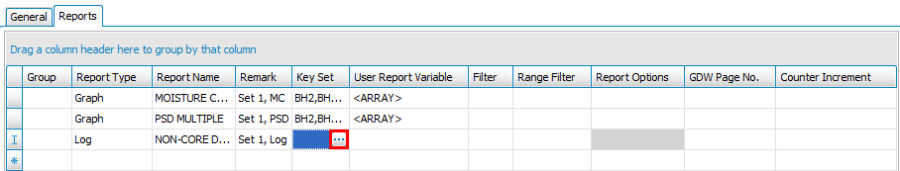
- Once back on the Reports tab and in a similar manner to Steps 11 through to 14, add NON-CORED DRILL HOLE Log report in the next empty row.
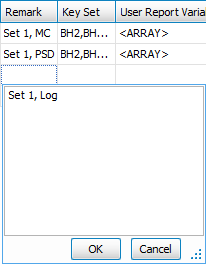
- In the Remark column on the row that contains the NON-CORED DRILL HOLE Log report, you should enter the text Set 1, Log and then click OK to assign the Remark value.
- In the Key Set column on the row that contains the NON-CORED DRILL HOLE Log report, click on the button to display the Key Set Selector form.
- Select the Key Sets 212, 449, 579, 580, 581, 582 and 583 from the Available Key Sets grid and then click the button to add them to the Selected Key Sets grid.
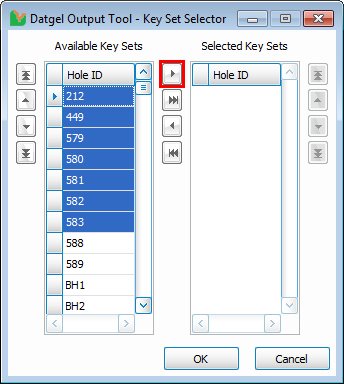
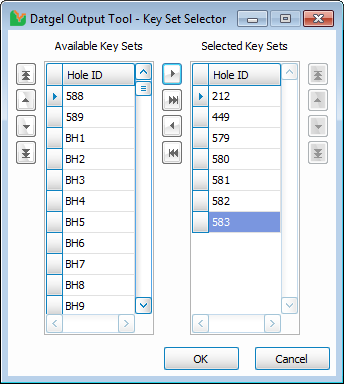
- Click OK to accept the Selected Key Sets.
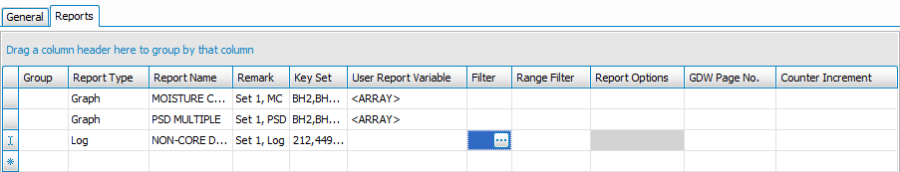
- Once completed, your screen should look similar to this:
- On the Output Tool form, click on the
 (Save Configuration As) button or press F12 to display the Save Configuration window.
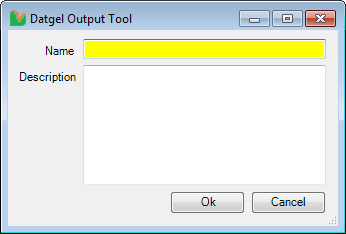
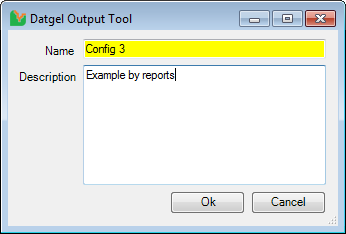
- Enter a name and a description into the corresponding fields in the window and click OK, once completed.
- On the Output Tool form, click Execute to generate the Output. You will then be prompted if you wish to save the output configuration or cancel the output run and you should make your choice accordingly.
- If you selected Yes or No, the Output Tool will generate the Output PDF file. If you click Cancel, you will be returned to the Output Tool form.
- Once the output run has been completed, the PDF file that should be open on your screen should look similar to this:
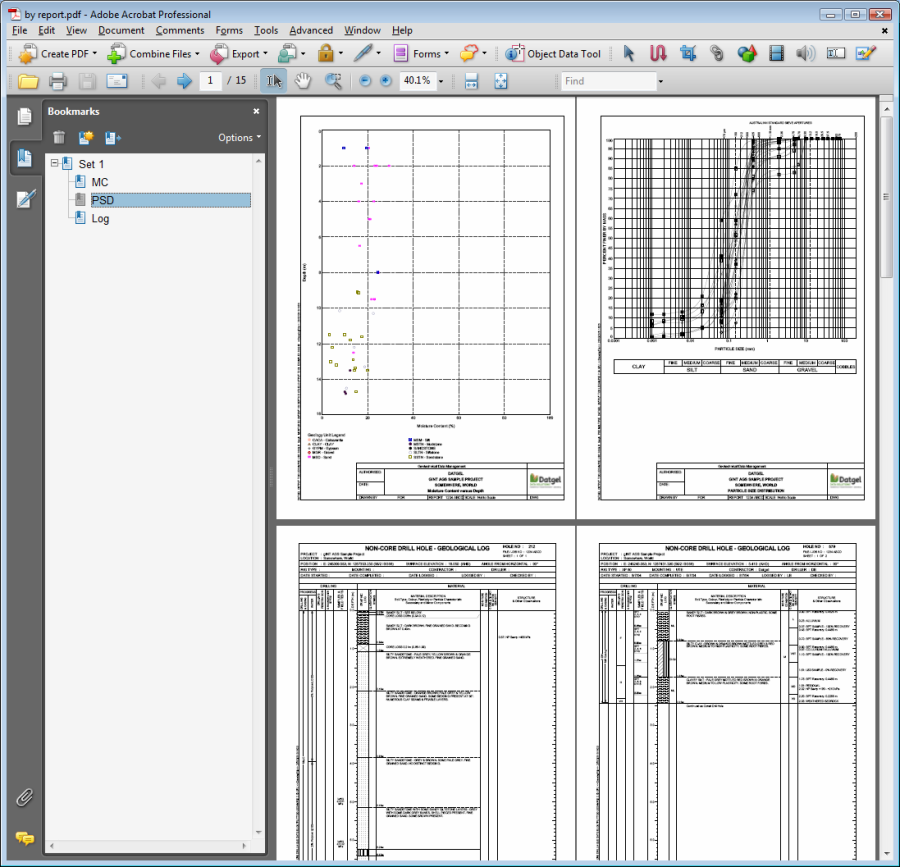
- By expanding the Set 1 bookmark you can see the child bookmarks (MC / PSD / Log) as defined on the Output Tool form