Composite Graph Report – GDW Export
Aim
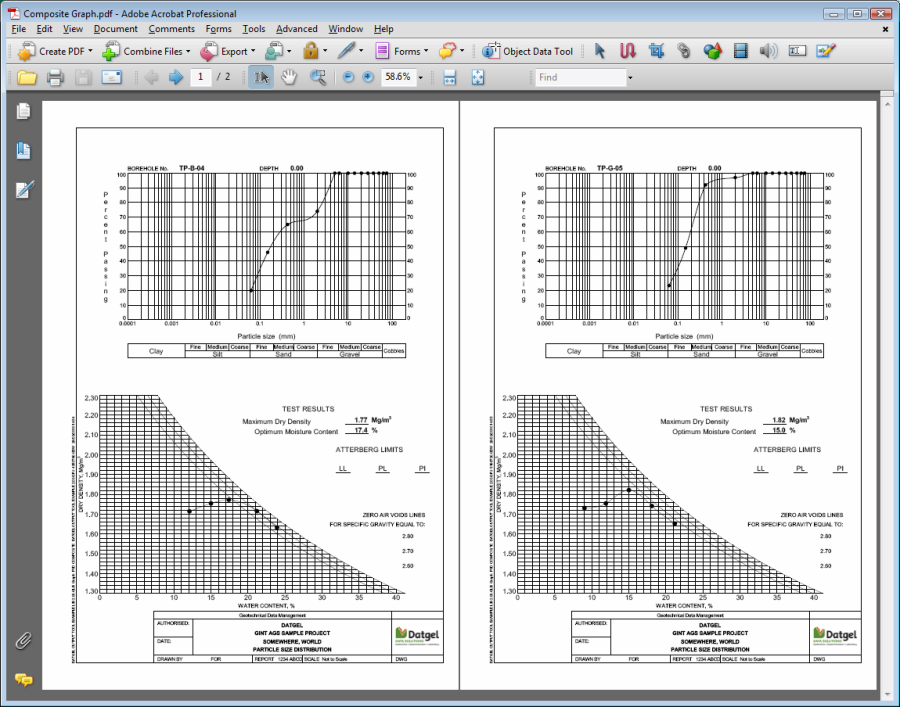
This example outputs the PSD COMPOSITE and the COMPACTION COMPOSITE Graph reports for each PointID to one gINT drawing page/sheet and then exports the page to the specified PDF file.
Procedure
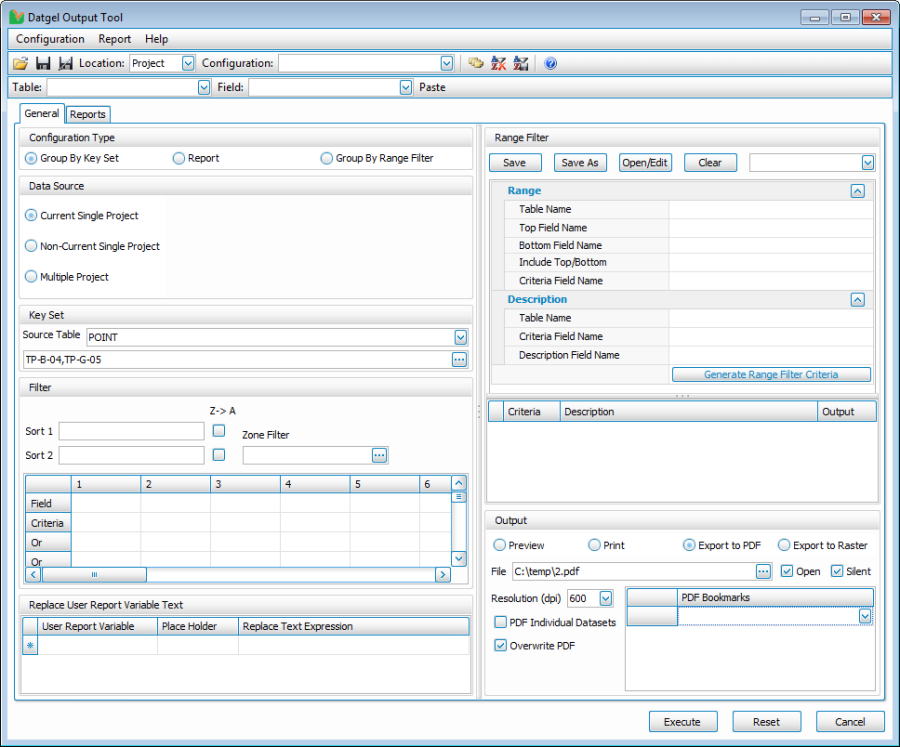
- Select INPUT | Add-Ins > Datgel Output Tool > Datgel Output Tool to launch the tool.
- On the General tab in the Key Set region, click on the
 button to display the Key Set Selector form.
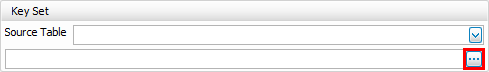
- Select the Key Sets TP-B-04 and TP-G-05 from the Available Key Sets grid and then click the
 button to add them to the Selected Key Sets grid.
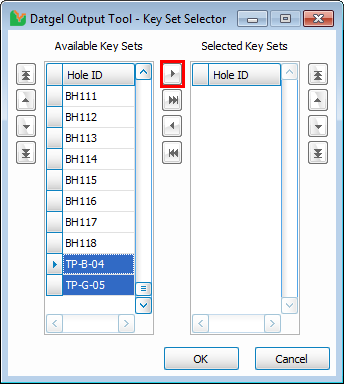
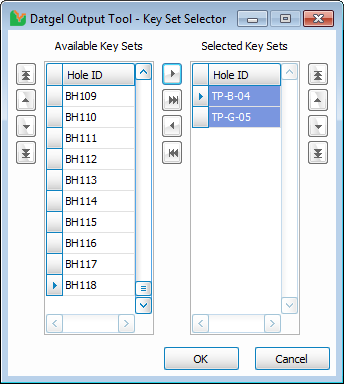
- Click OK to accept the Selected Key Sets.
- On the General tab in the Output region, click on the
 button to launch a file browser window.
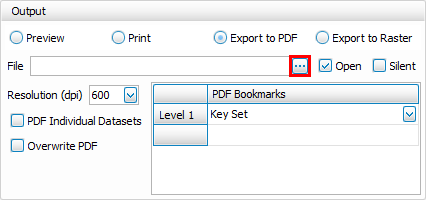
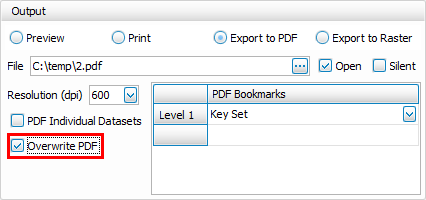
- In the file browser window, navigate to a folder that you want to save the PDF file to and enter the name that you want to call the file in the File Name field.
- Click on the Overwrite PDF option to overwrite the PDF file if it already exists.
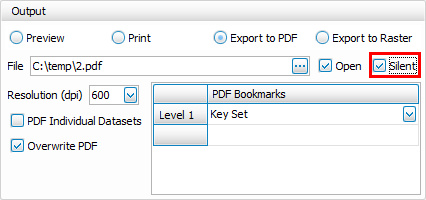
- Click on the Silent option to prevent the error report form from displaying at the end of the output run.
- In the PDF Bookmarks area, click on the Level 1 PDF Bookmarks label and press Delete (on your keyboard) to remove the default bookmark.
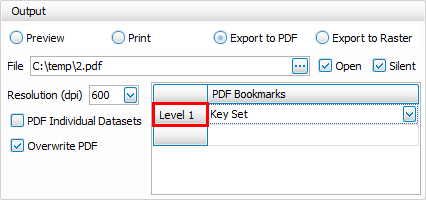
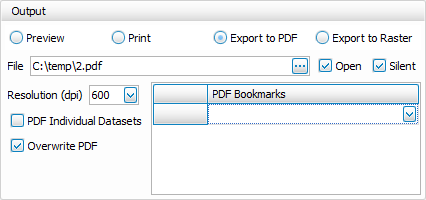
- Once completed, your screen should look similar to this:
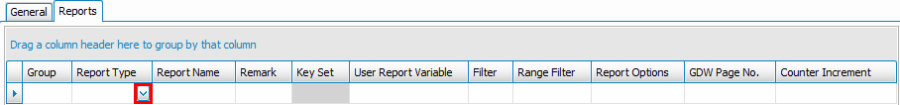
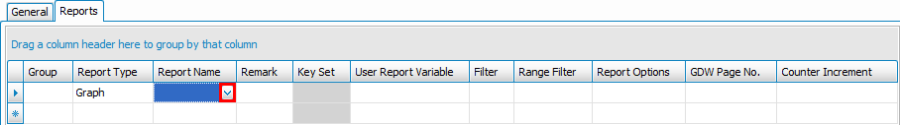
- Now go to the Reports tab.
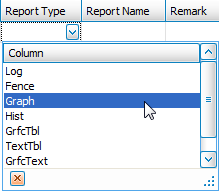
- In the Report Type column, click on the button to display a list of the available types of reports in the library file.
- Select the Graph report option.
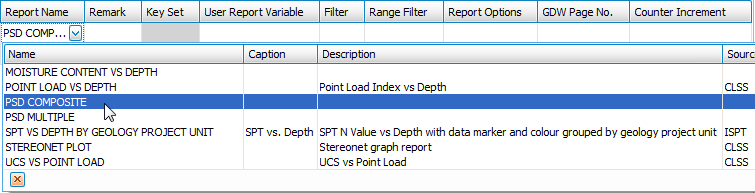
- In the Report Name column, click on the button to display a list of the available reports in the library file.
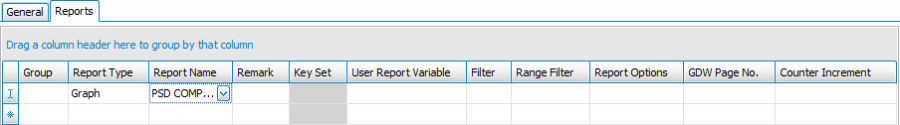
- Select the PSD COMPOSITE report.
- At this stage your form should look similar to this:
- In a similar manner to Steps 12 through to 15, add the COMPACTION COMPOSITE Graph report in the next empty row.
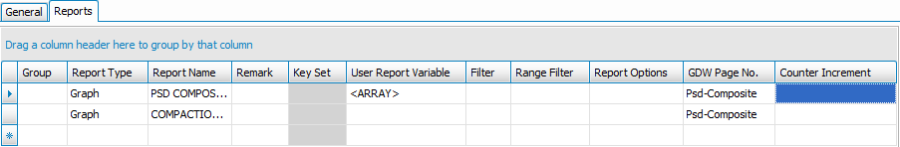
- Next, we need to assign the same GDW Page No. to both of these reports. You should enter the text Psd-Composite into the GDW Page No. column on the row that contains the PSD COMPOSITE Graph report. Then copy paste from one cell to the next.
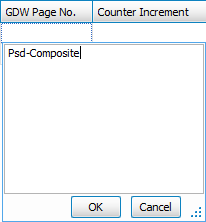
- Once completed, your screen should look similar to this:
- On the Output Tool form, click on the
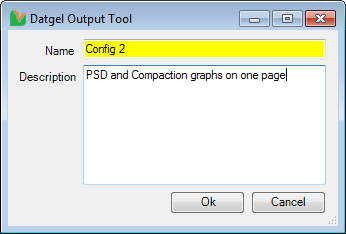
 (Save Configuration As) button or press F12 to display the Save Configuration window.
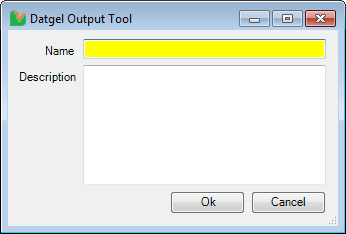
- Enter a name and a description into the corresponding fields in the window and click OK, once completed.
- On the Output Tool form, click Execute to generate the Output. You will then be prompted if you wish to save the output configuration or cancel the output run and you should make your choice accordingly.
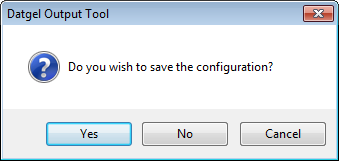
- If you selected Yes or No, the Output Tool will generate the Output PDF file. If you click Cancel, you will be returned to the Output Tool form.
- Once the output run has been completed, the PDF file that should be open on your screen should look similar to this: