Group by Range Filter
Aim
This example shows the batch output of a moisture content graph, a PSD graph and a SPT vs. Depth graph, grouped by Geological Unit. It uses the Replace User Report Variable functionality to set the Drawn, Approved and Approved Date, and append the Geological Unit Description to the end of the figure title.
Procedure
- Select INPUT |Add-Ins > Datgel Output Tool >Datgel Output Tool to launch the tool.
- On the General tab in the Configuration Type region, check the Group By Range Filter bullet to group by a range filter.

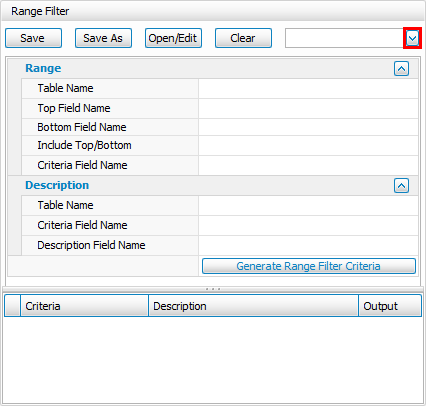
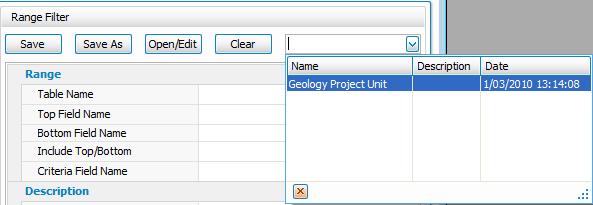
- On the General tab in the Range Filter region, click on the button to display the drop-down list that contains the tables from your project file.
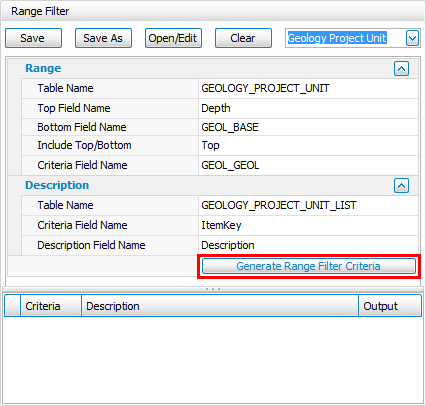
- Select Geology Project Unit option.
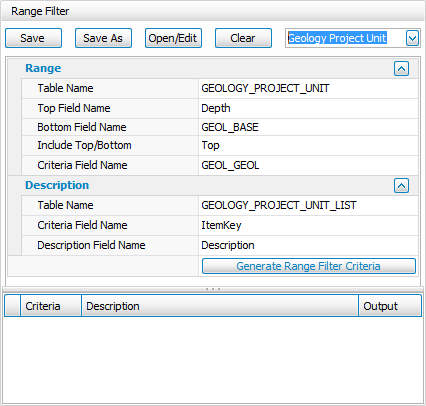
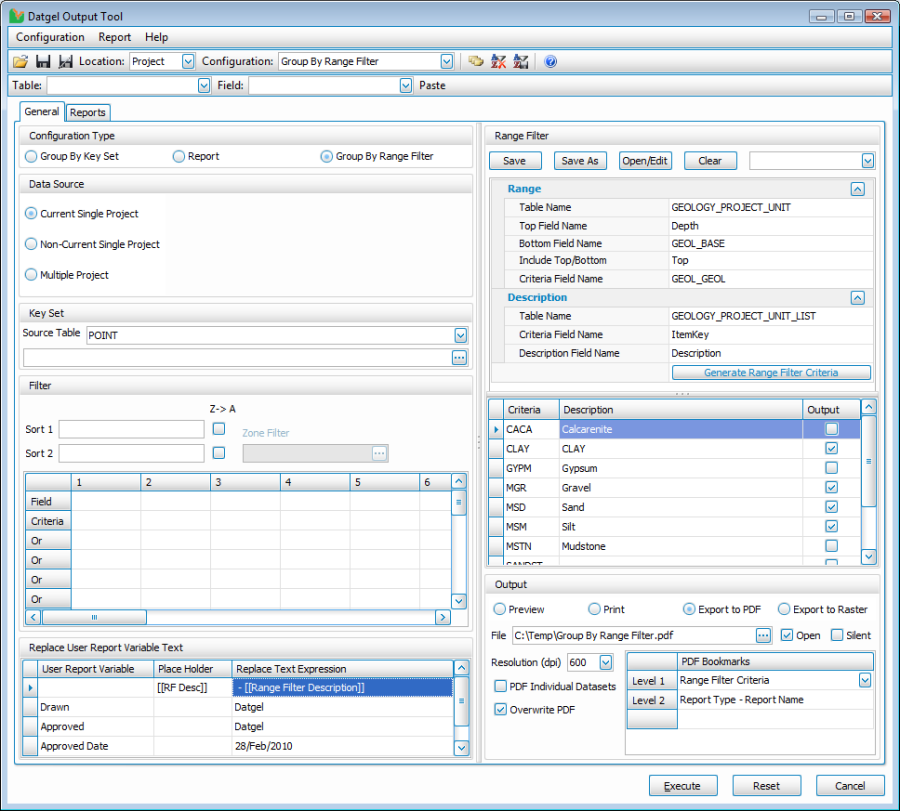
- This will automatically populate the Range Filter fields with a previously saved setting and at this stage your form should look similar to this:
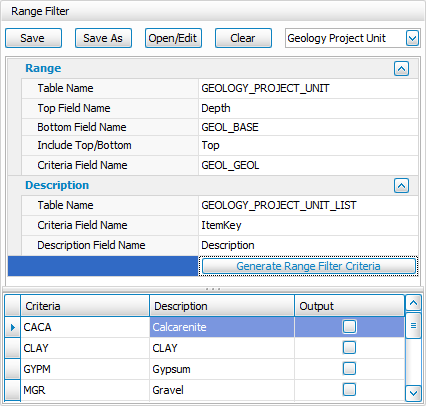
- Next click on the Generate Range Filter Criteria button.
- This will populate the grid with the criteria, based on the configuration of the Range and Description grid. Your form should now look similar to this:
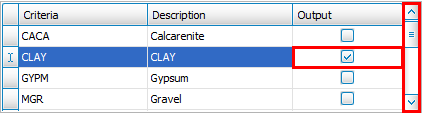
- In the Output column, check the CLAY, MGR, MSD, MSM, SLTN and SSTN Criteria. You will need to use the scroll to move down the grid.
- On the General tab in the Output region, click on the
 button to launch a file browser window.
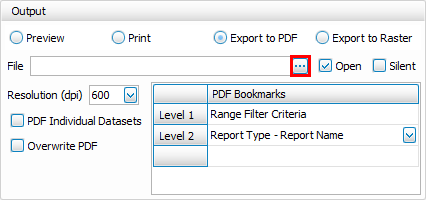
- In the file browser window, navigate to a folder that you want to save the PDF file to and enter the name that you want to call the file in the File Name field.
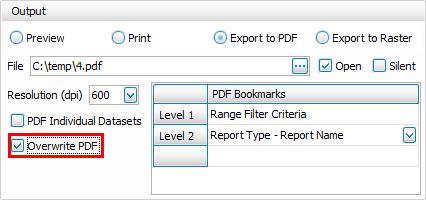
- Click on the Overwrite PDF option to overwrite the PDF file if it already exists.
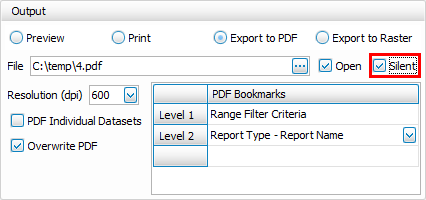
- Click on the Silent option to prevent the error report form from displaying at the end of the output run.
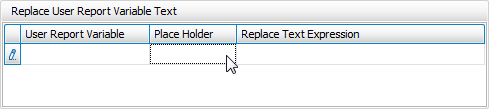
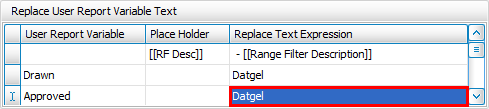
- Next, we need to use the Replace User Report Variable Text to globally configure our User Report Variables and define the Place Holders that will be added to the User Report Variables, which will then be replaced with the Replace Text Expression at output time.
- On the General tab in the Replace User Report Variable Text region, left click on the first available row in the Place Holder column to select that field.
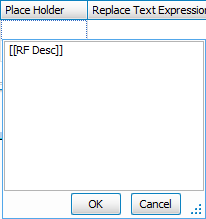
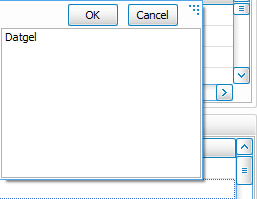
Then left click on that field again and enter the text [[RF Desc]] to define the Place Holder. Click OK to accept the text.
Then on the same row, left click on the Replace Text Expression field. Then left click on that field again and enter the text - [[Range Filter Description]] to define the Replace Text Expression. Click OK to accept the text.
Note there is a space to the left of -.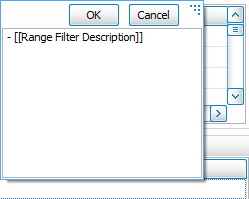
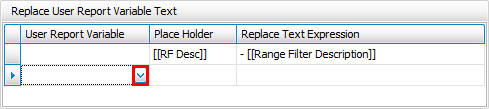
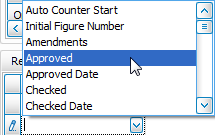
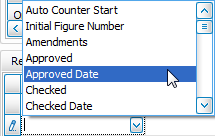
- On the next empty row in the Replace User Report Variable Text region, click on the User Report Variable field to select it and then click on the
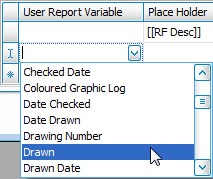
 button to display the list of User Report Variables.
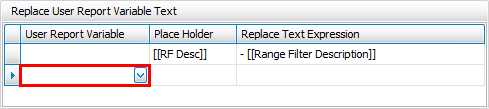
- Select the Drawn User Report Variable.
- In a similar manner to Step 16 and on the same row, enter the text Datgel in the Replace Text Expression field and click OK to accept the text.
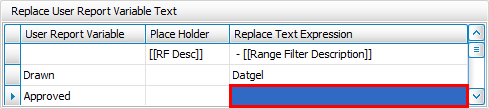
- On the next empty row in the Replace User Report Variable Text region in a similar manner to Steps 17 and 18, select the Approved User Report Variable.
- In a similar manner to Step 16 and on the same row, enter the text Datgel in the Replace Text Expression field and click OK to accept the text.
Alternatively, you can copy the value from the previous row (by left clicking on required field and using CTRL+C) and then paste it into the current row (by selecting the required empty field and using CTRL+V).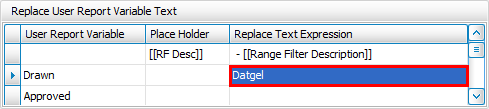
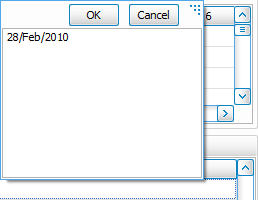
- On the next empty row in the Replace User Report Variable Text region in a similar manner to Steps 17 and 18, select the Approved Date User Report Variable.
- In a similar manner to Step 16 and on the same row, enter the date 28/Feb/2010 in the Replace Text Expression field and click OK to accept the text.
- Once completed, your screen should look similar to this:
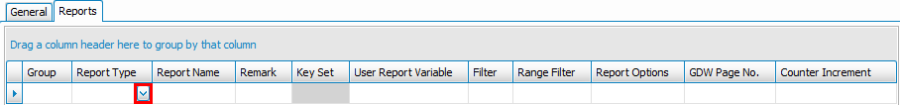
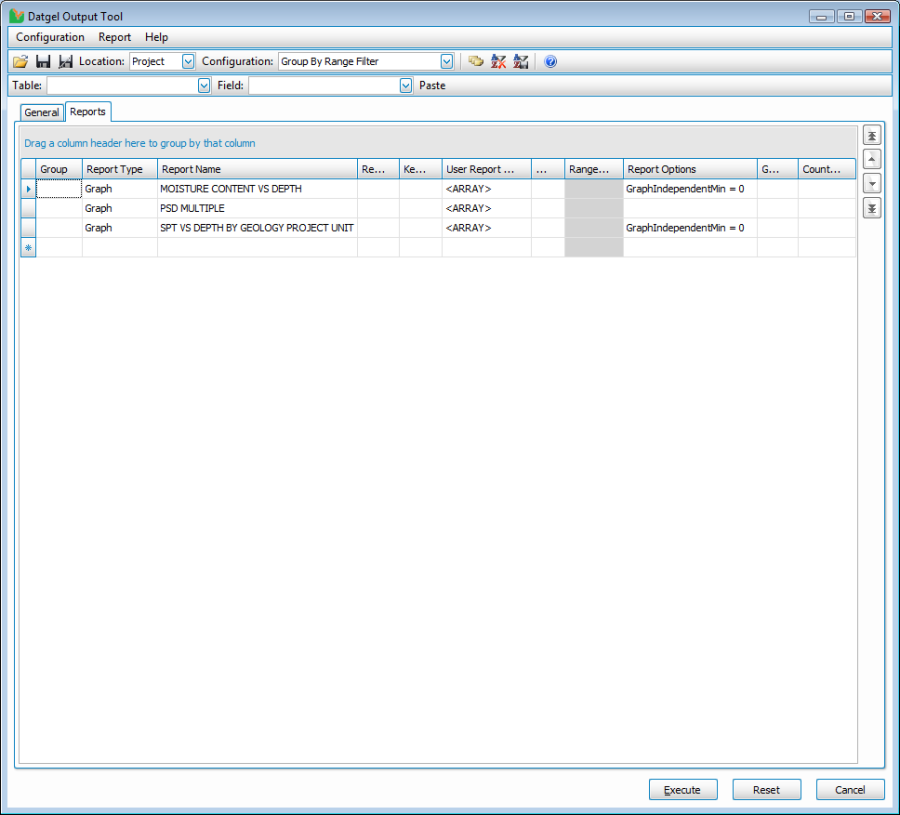
- Now go to the Reports tab.
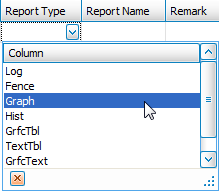
- In the Report Type column, click on the button to display a list of the available types of reports in the library file.
- Select the Graph report option.
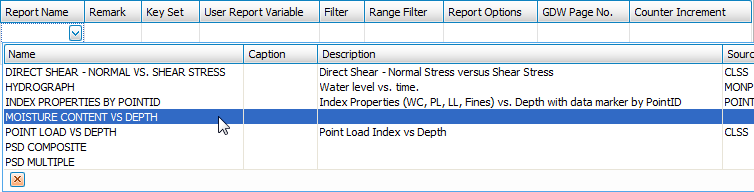
- In the Report Name column, click on the button to display a list of the available reports in the library file.
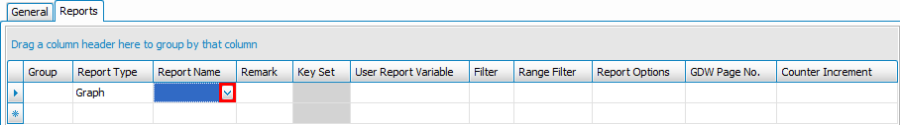
- Select the MOISTURE CONTENT VS DEPTH report.
- In a similar manner to Steps 26 through to 29, add the PSD MULTIPLE Graph report in the next empty row.
- In a similar manner to Steps 26 through to 29, add the SPT VS DEPTH BY GEOLOGY PROJECT UNIT Graph report in the next empty row.
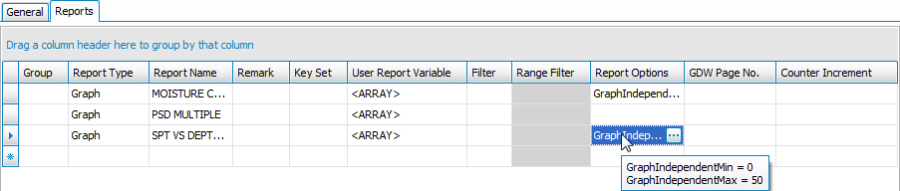
- Next, we want to edit the Report Options used on the MOISTURE CONTENT VS DEPTH Graph report to ensure all depth graphs have a depth range of 0 to 50 m. To do so, left click on the Report Option column on the row that contains the MOISTURE CONTENT VS DEPTH Graph report.
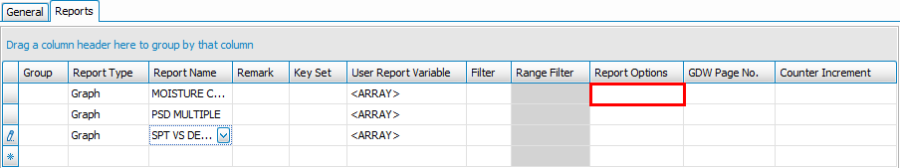
- Then click on the button.
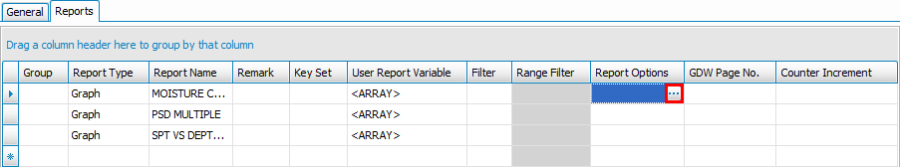
- This will launch the Report Options window.
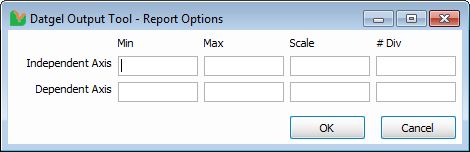
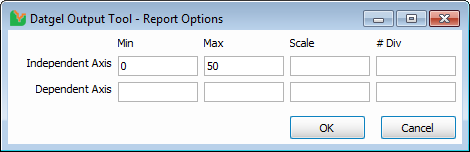
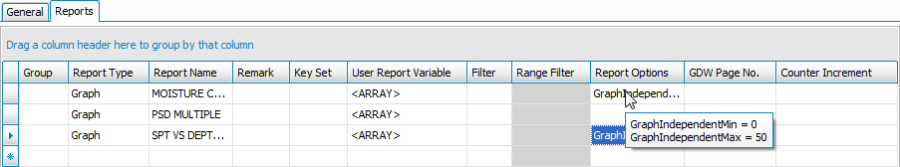
- For the Independent Axis, enter 0 for the Min value and 50 for the Max value. Click OK to accept the text.
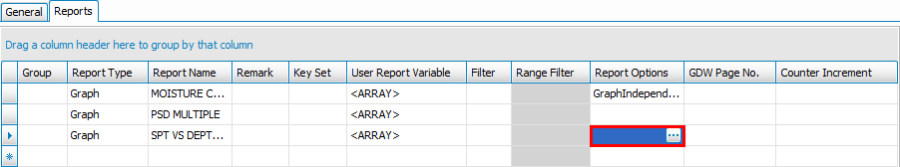
- In a similar manner to Steps 32 through to 35, define the Min and Max values for the Independent Axis for the SPT VS DEPTH BY GEOLOGY PROJECT UNIT Graph report.
Alternatively, you can copy the Report Options specification for the MOISTURE CONTENT VS DEPTH Graph report (by left clicking on Report Options field and using CTRL+C) and then paste it into the row containing the SPT VS DEPTH BY GEOLOGY PROJECT UNIT Graph report (by selecting the required empty field and using CTRL+V).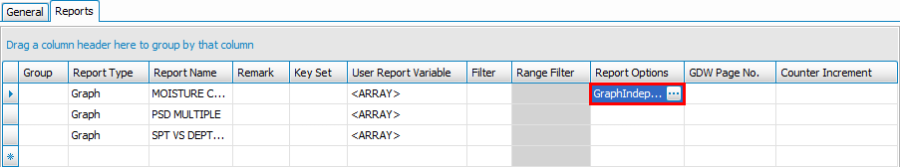
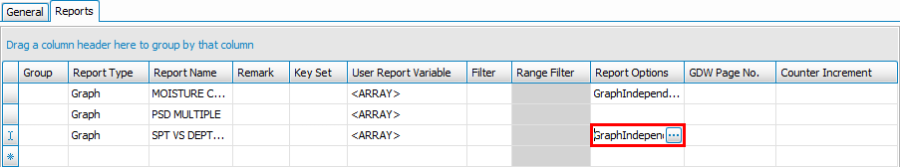
- You can confirm that the specified Report Options are the same by moving the mouse pointer over each field to display a defined values in the context sensitive window, as illustrated below:
- Next, we want to edit the User Report Variables used on the MOISTURE CONTENT VS DEPTH Graph report. To do so, click on the button in the User Report Variable column on the row that contains the MOISTURE CONTENT VS DEPTH Graph report.
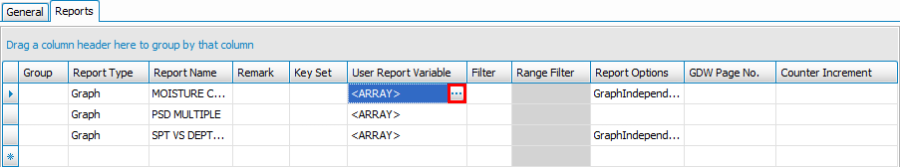
- This will launch the gINT Output User Report Variables dialogue window.
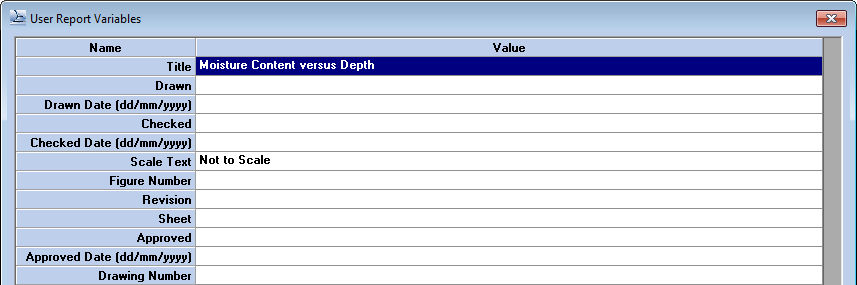
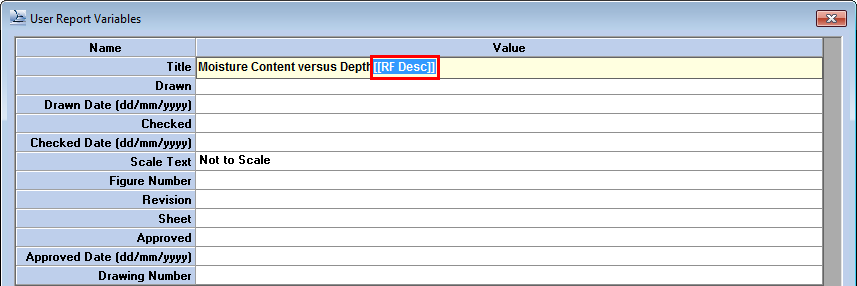
- In the Title field, enter the text _[[RF Desc]] after the default text Moisture Content versus Depth. This will result in the [[RF Desc]] Place Holder text, as entered in the Replace User Report Variable Text region on the General tab (see Steps 14 through to 15), being replaced with the text contained in the relevant Range Filter Description.
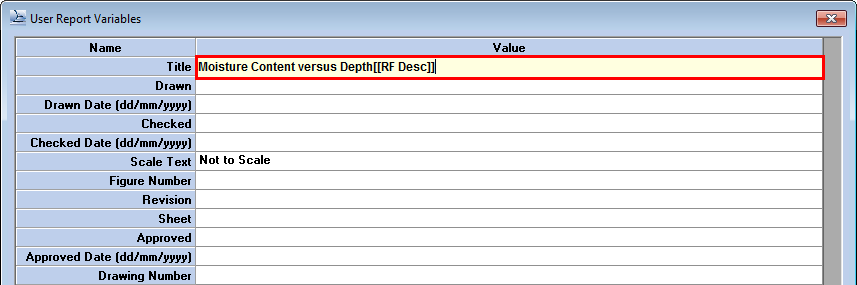
- Then highlight this text and copy it (CTRL+C) and then click OK to return to the Output Tool Form. (We will add this text to the User Report Variable of the PSD MULTIPLE Graph report next).
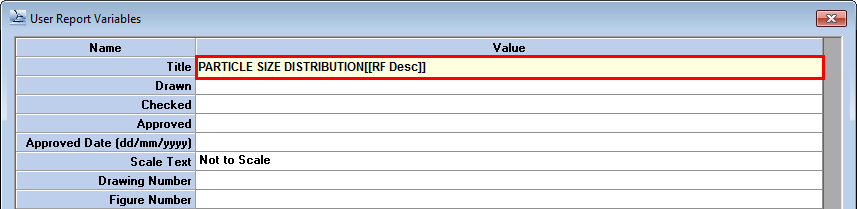
In a similar manner to Steps 38 through to 39, paste the (previously copied) text [[RF Desc]] into the PSD MULTIPLE Graph report User Report Variable Title field and then click OK to return to the Output Tool Form.
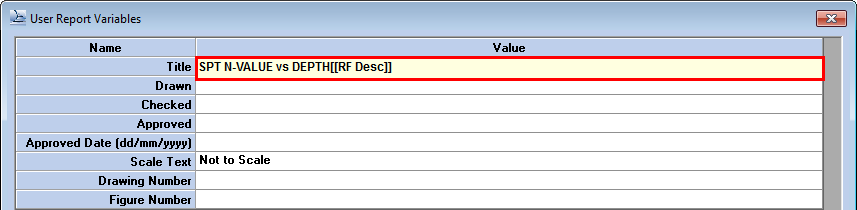
- Repeat Step 42 for the SPT VS DEPTH BY GEOLOGY PROJECT UNIT Graph report.
- Once completed, your screen should look similar to this:
- On the Output Tool form, click on the
 (Save Configuration As) button or press F12 to display the Save Configuration window.
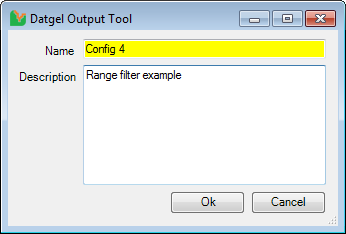
- Enter a name and a description into the corresponding fields in the window and click OK, once completed.
- On the Output Tool form, click Execute to generate the Output. You will then be prompted if you wish to save the output configuration or cancel the output run and you should make your choice accordingly.
- If you selected Yes or No, the Output Tool will generate the Output PDF file. If you click Cancel, you will be returned to the Output Tool form.
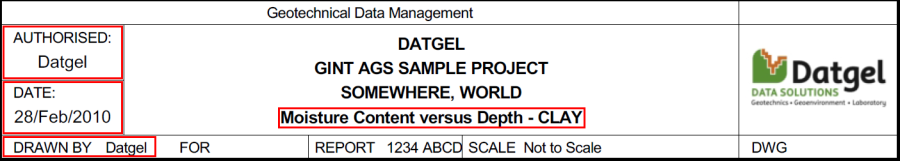
- Once the output run has been completed, the PDF file that should be open on your screen should look similar to this:
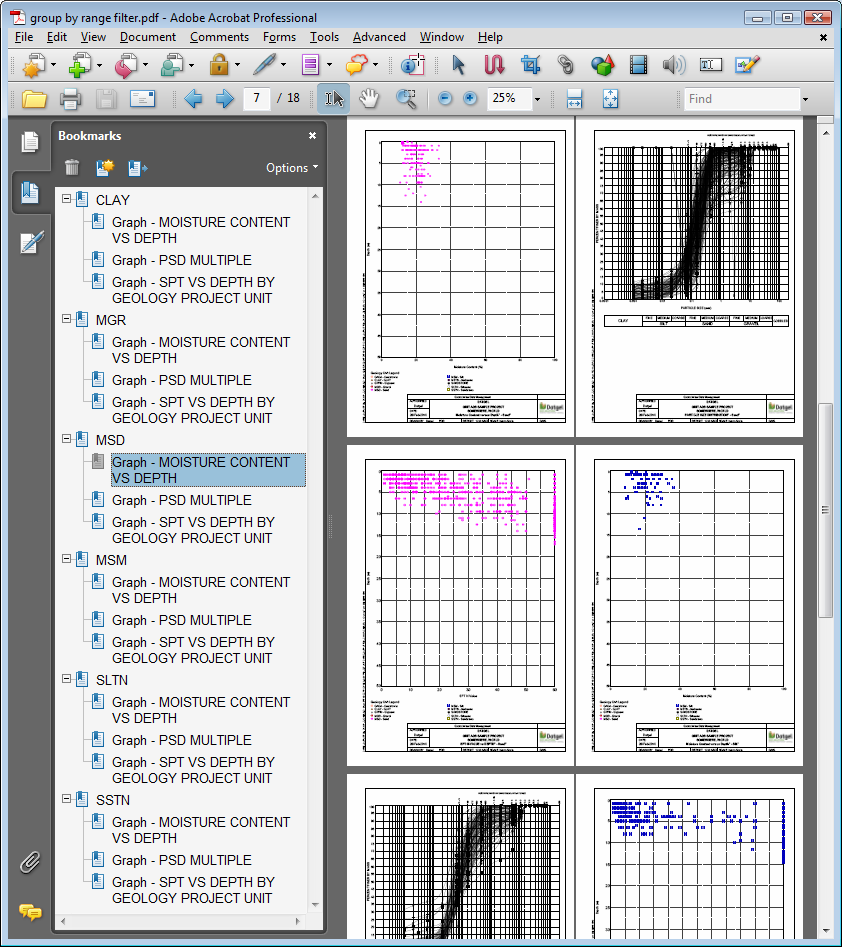
- By expanding the main bookmark, you can see the child bookmarks (CLAY/MGR/MSD/MSM/SLTN/SSTN) as defined on the Output Tool form.
- If you observe the title area of a report page, you will see that:
- The text Datgel is displayed in the AUTHORISED box of the report;
- The text 28/Feb/2010 is displayed in the DATE: box of the report;
- The text Datgel is displayed in the DRAWN BY: box of the report; and
- The default title of the report has been suffixed with the relevant " – Range Filter Description" text, e.g. Moisture Content versus Depth – CLAY