Output Many Reports grouped by PointID
Aim
This example shows the batch output of a non-cored log, cored log, and SPT vs. depth graph grouped by PointID. This is a common scenario for an appendix of a site investigation report.
Procedure
- Select INPUT |Add-Ins > Datgel Output Tool >Datgel Output Tool to launch the tool.
- On the General tab in the Key Set region, click on the
 button to display the Key Set Selector form.
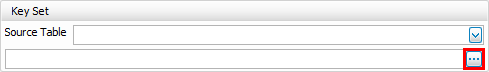
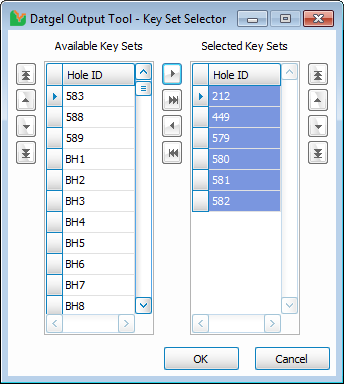
- Select the Key Sets 212, 449, 579, 580, 581 and 582 from the Available Key Sets grid and then click the
 button to add them to the Selected Key Sets grid.
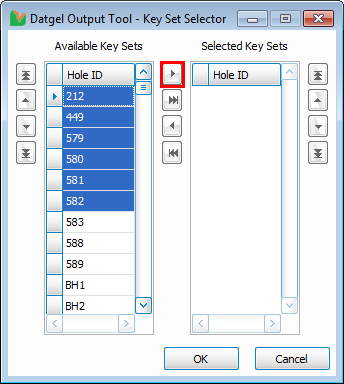
- Remove Key Set number 582 by selecting it in the Selected Key Sets grid and then click on the
 button to remove it, alternatively double click on 582.
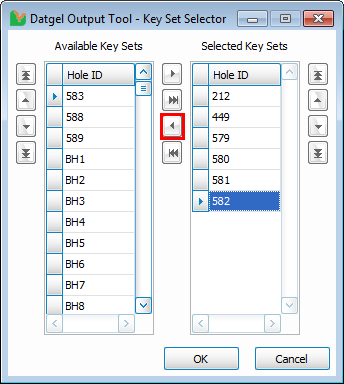
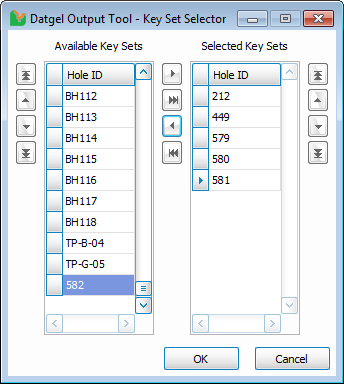
- Click OK to accept the Selected Key Sets.
- On the General tab in the Output region, click on the button to launch the file browser.
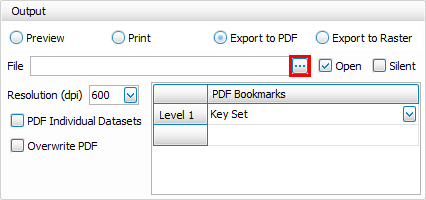
- In the file browser window, navigate to a folder that you want to save the PDF file to and enter the name that you want to call the file in the File Name field.
- In the PDF Bookmarks area, click on the next available field and then click on the
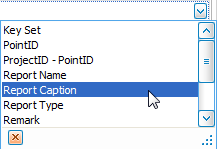
 button to display the list of Bookmarks
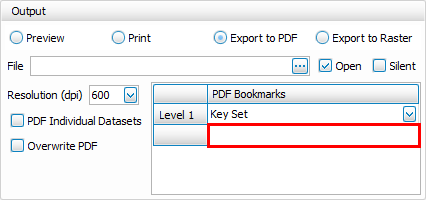
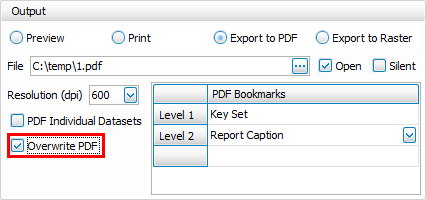
- Click on the Report Caption option to add this Bookmark type to the Bookmark hierarchy.
- Click on the Overwrite PDF option to overwrite the PDF file if it already exists.
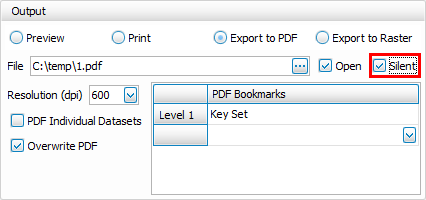
- Click on the Silent option to prevent the error report form from displaying at the end of the output run.
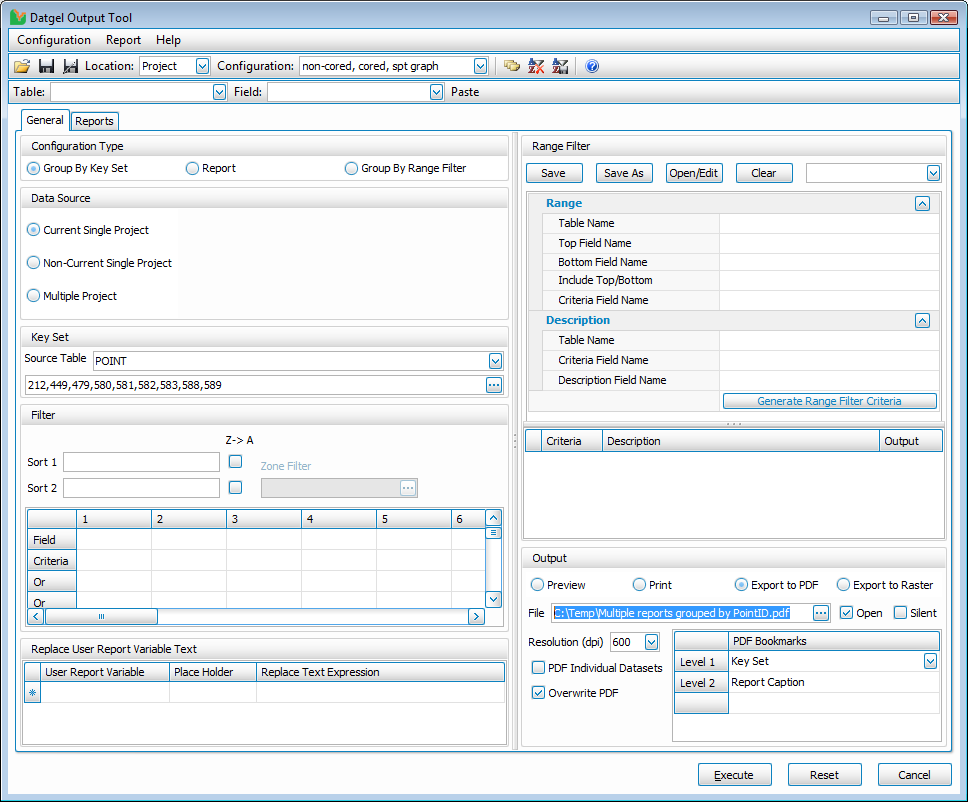
- Once completed, your screen should look similar to this:
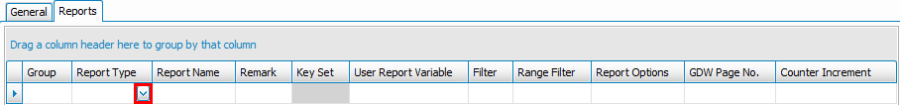
- Now go to the Reports tab.
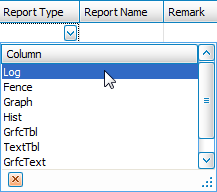
- In the Report Type column, click on the button to display a list of the available types of reports in the library file.
- Select the Log report option.
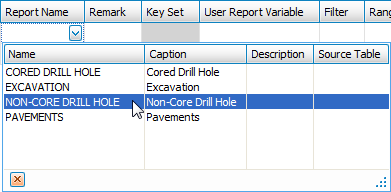
- In the Report Name column, click on the button to display a list of the available reports in the library file.
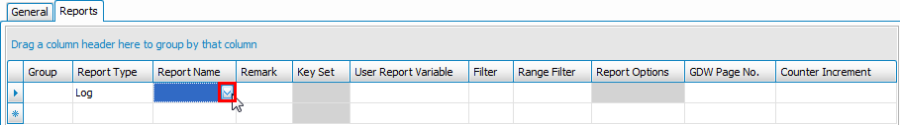
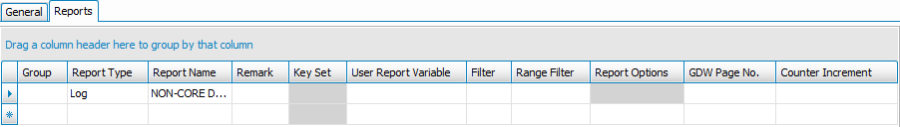
- Select the NON-CORED DRILL HOLE report.
- At this stage your form should look similar to this:
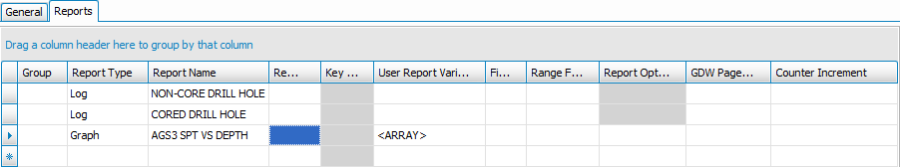
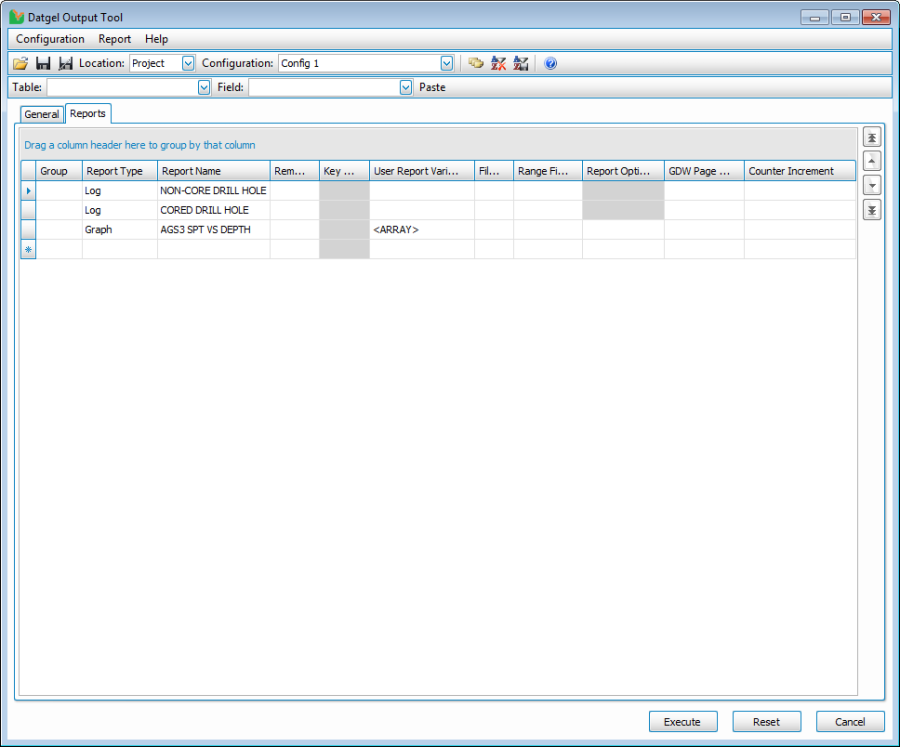
- In a similar manner to Steps 14 through to 17, add the CORED DRILL HOLE Log report and the AGS3 SPT VS DEPTH Graph report in the next empty row.
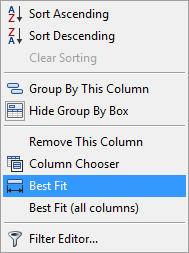
- You can make the report names more visible by right clicking on the Report Name column label and then selecting the Best Fit or Best Fit (all columns) option in the menu that is displayed.
- Once completed, your screen should look similar to this:
- Next, we want to edit the User Report Variables used on the AGS3 SPT VS DEPTH Graph report. To do so, click on the button in the User Report Variable column on the row that contains the AGS3 SPT VS DEPTH Graph report.
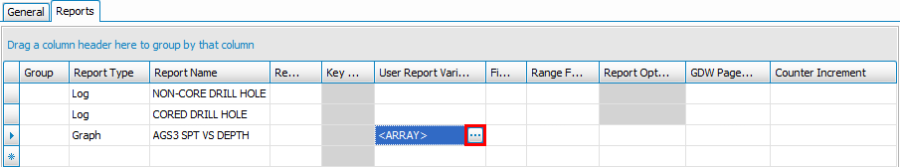
- This will launch the gINT Output User Report Variables dialogue window.
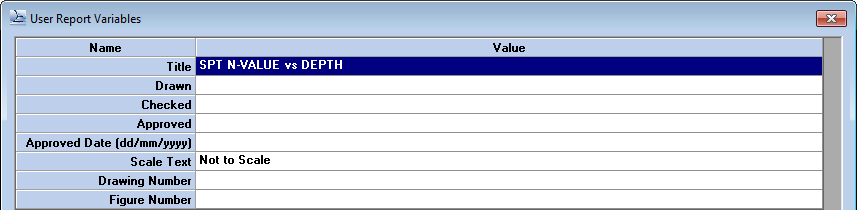
- In the Drawn field, enter Datgel and then click OK to return to the Output Tool Form.
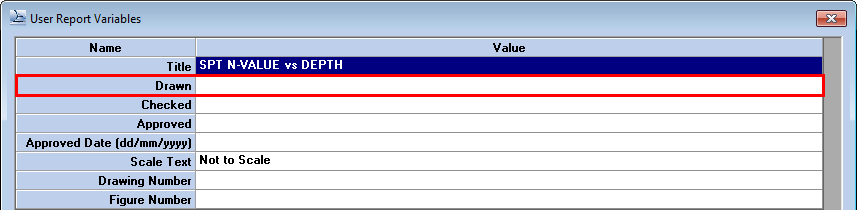
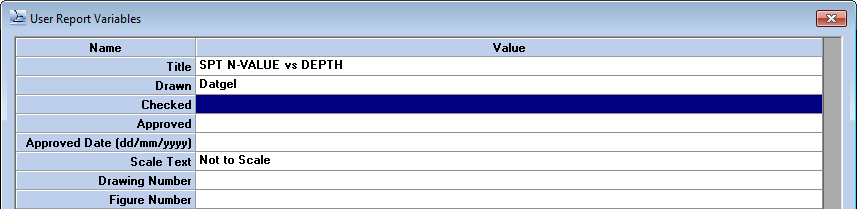
- Once completed, your screen should look similar to this:
- On the Output Tool form, click on the
 (Save Configuration As) button or press F12 to display the Save Configuration window.
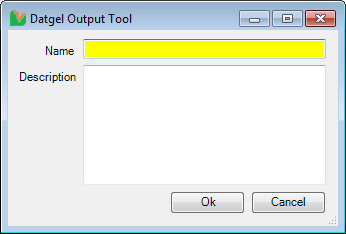
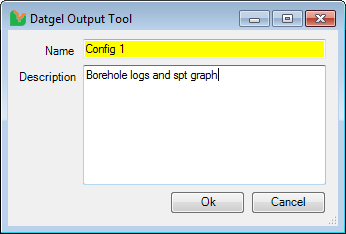
- Enter a name and a description into the corresponding fields in the window and click OK, once completed.
- On the Output Tool form, click Execute to generate the Output. You will then be prompted if you wish to save the output configuration or cancel the output run and you should make your choice accordingly.
- If you selected Yes or No, the Output Tool will generate the Output PDF file. If you click Cancel, you will be returned to the Output Tool form.
- Once the output run has been completed, the PDF file that should be open on your screen should look similar to this:
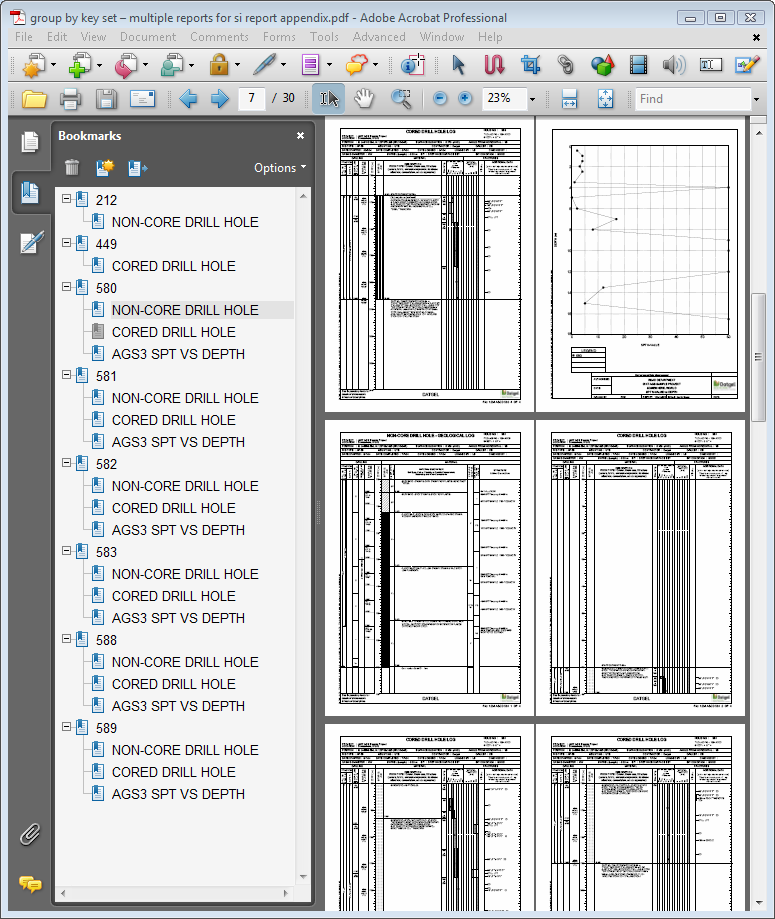
- By expanding the bookmarks, you can see each report type (where there is relevant data) has been created and they are grouped by PointID.