Piezometer
Installation
A step by step example is provided in section Tutorials.
Piezometer
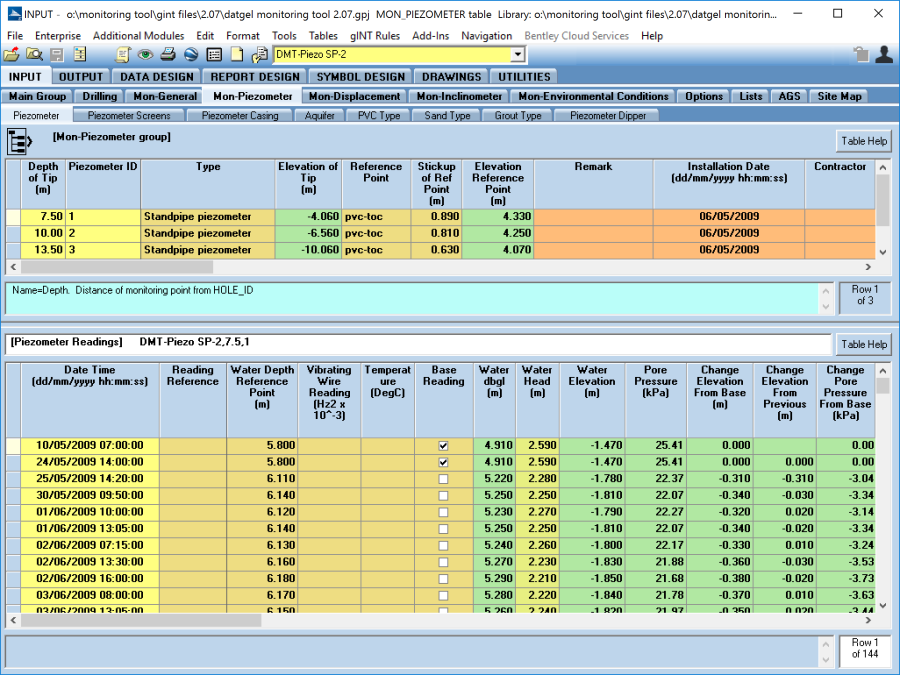
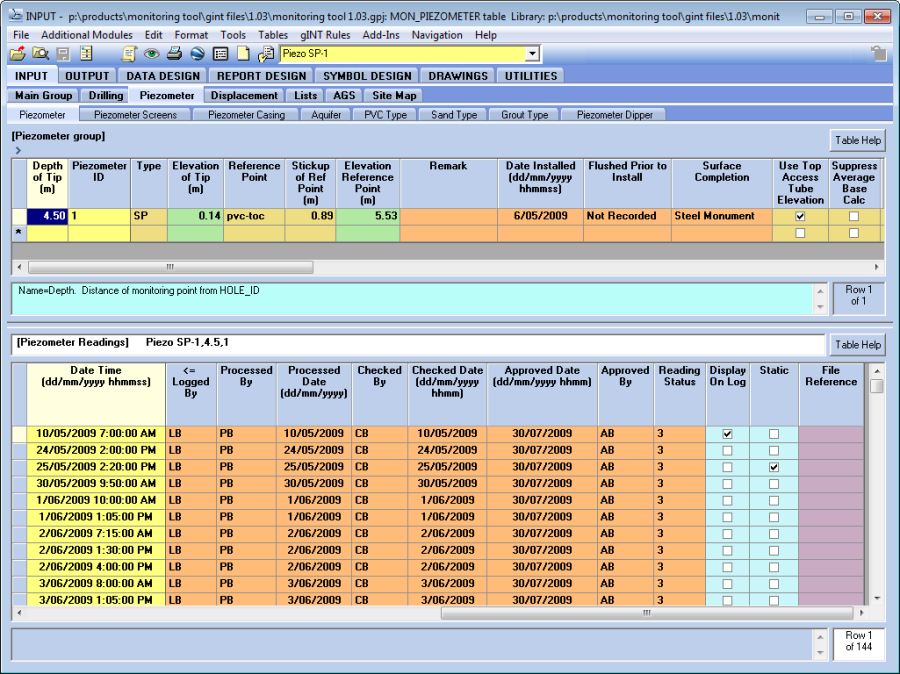
The general piezometer installation details for each PointID should be entered on the Piezometer (upper) table. As multiple installations can be installed, each individual installation is uniquely identified by its tip depth (Depth_of_Tip) and by its ID (Piezometer_ID). See Tutorials for examples on how to record a single pipe installation and multiple pipe installation.
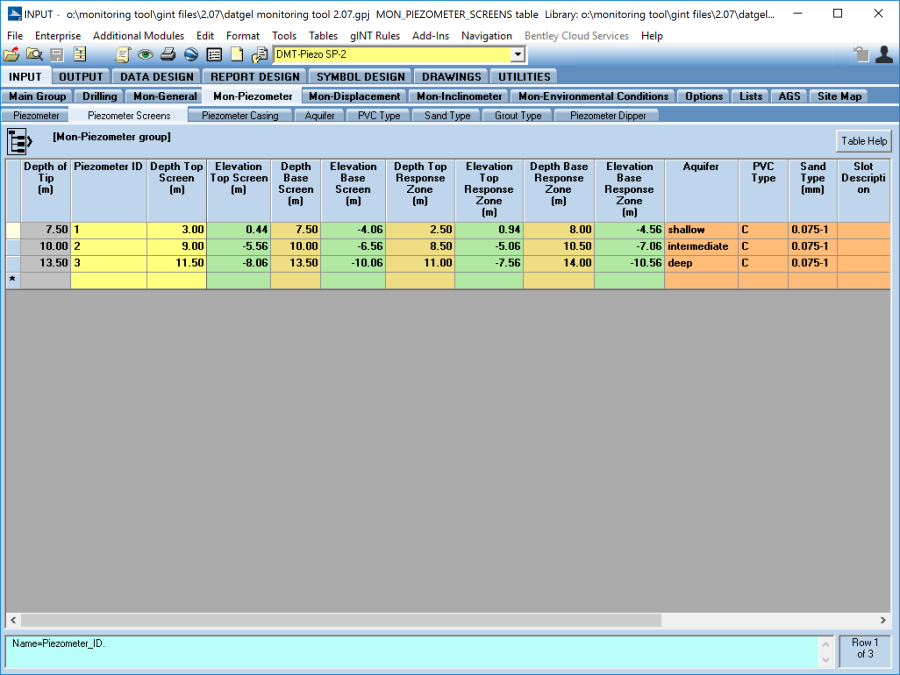
Piezometer Screen and Response Zones
The Piezometer_Screens table is used to store the installation screen and the response zone information and associated metadata, such as installation material types that are used.
The installation screen section (Depth_Top_Screen and Depth_Base_Screen) refers to the top and bottom depths of piezometer that allows for the free movement of groundwater into the well. The response zone (Depth_Top_Response_Zone and Depth_Base_Response_Zone) refers to the top and bottom depths of the backfill medium that surrounds the screened section.
To correctly display the installation on the provided log reports, the values entered in the Depth_Top_Response_Zone and Depth_Base_Response_Zone fields on the Piezometer_Screens table should match the Top and Bottom fields on the Backfill table.
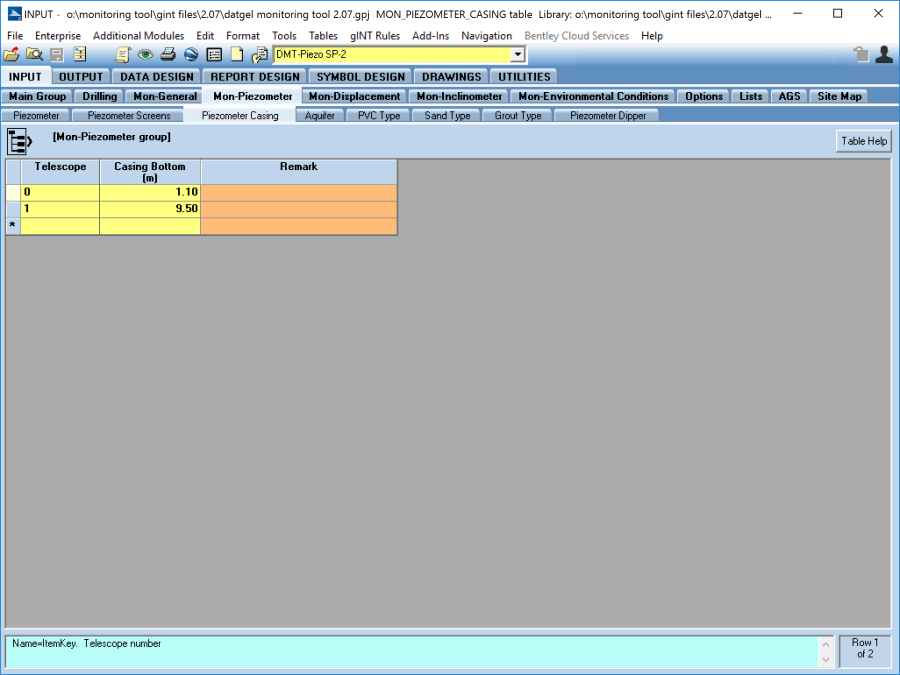
Piezometer Casing
If the drill casing has been left in the ground as part of the installation, the information is recorded on the Piezometer_Casing table by entering the bottom depth (and telescope level if applicable) of the casing.
Monitoring Readings
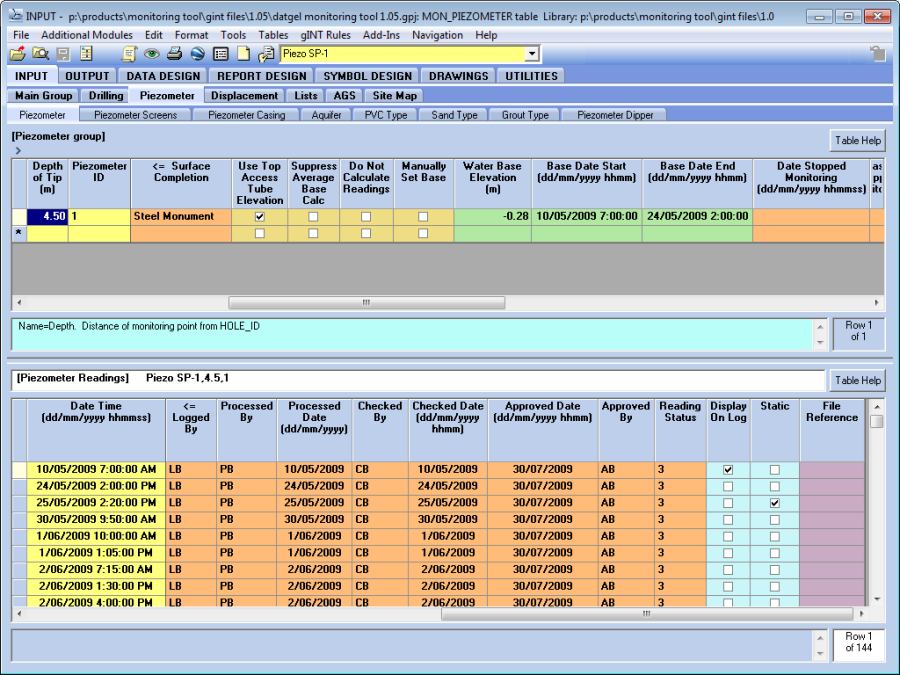
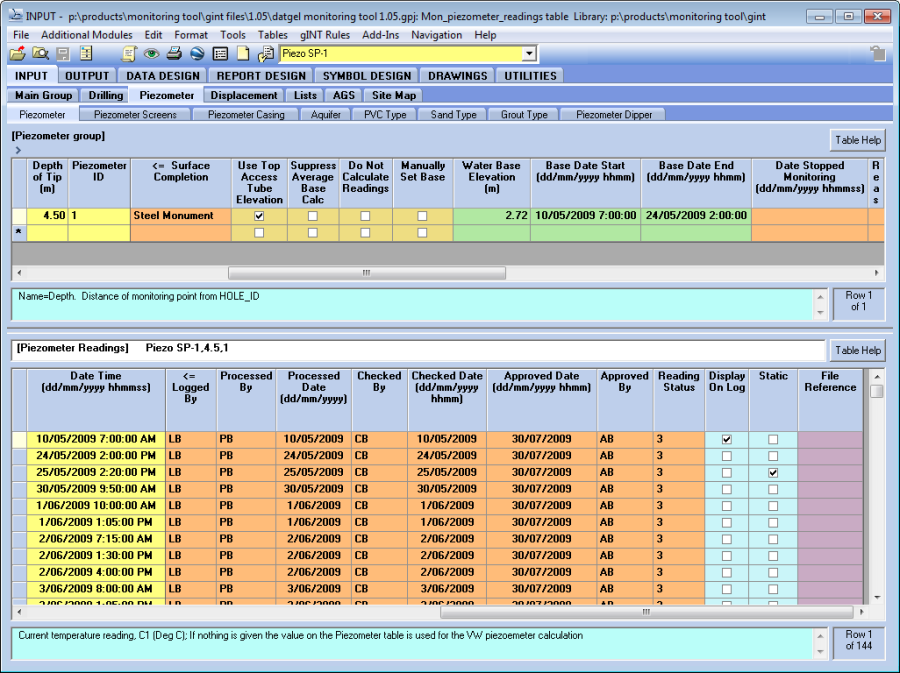
The ground water monitoring readings are recorded on the Piezometer (lower) table by entering the date and time when the monitoring occurred in the Date_Time field and the water depth in the Water_Depth_Reference_Point field.
If the recorded result is inferred to be a static level, check the Static field and the reading value will be displayed on the log report, in the column header area.
Base Readings
The base field value can be set in two ways:
- Automatically. If a recorded result is the initial reading for that piezometer installation, you can check the Base field on the Piezometer (lower) table to indicate this and the base reading will be displayed in the applicable Base value fields on the Piezometer (upper) table. If you check more than one reading as the base reading, then the value displayed in the Base field will be an average of these readings.
- Manually. If you wish to manually record the base values of the installation, then check the Manually_Set_Base field on the Piezometer (upper) table and enter this data into the base value fields. If you want to calculate these values, then leave these fields blank and don't check the Manually_Set_Base field.
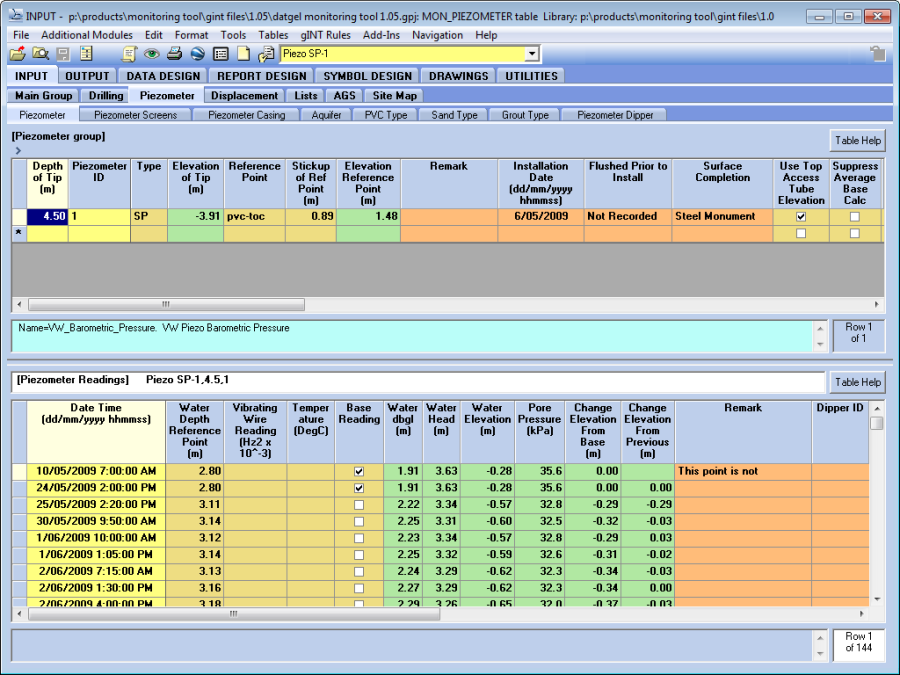
Top Access Tube Elevation Reference Point
If the groundwater level is to be monitored from the top of the piezometer installation, the elevation level of which may change over the course of the monitoring period, then you should check the Use_Top_Access_Tube_Elevation field on the Piezometer (upper) table to calculate the Water_Elevation field. A typical scenario where you would wish to check this field would be for a piezometer installation on a land reclamation project.
If you check Use_Top_Access_Tube_Elevation field on the Piezometer (upper) table then you must first enter the survey information on the Displacement Tables.
If the Use_Top_Access_Tube_Elevation field on the Piezometer (upper) table is checked then the selected Monitoring_Point_ID on the Displacement (upper) table for the PointID must be Top Access Tube. The Type would be MSET. The survey data is then entered on the Displacement (lower) table.
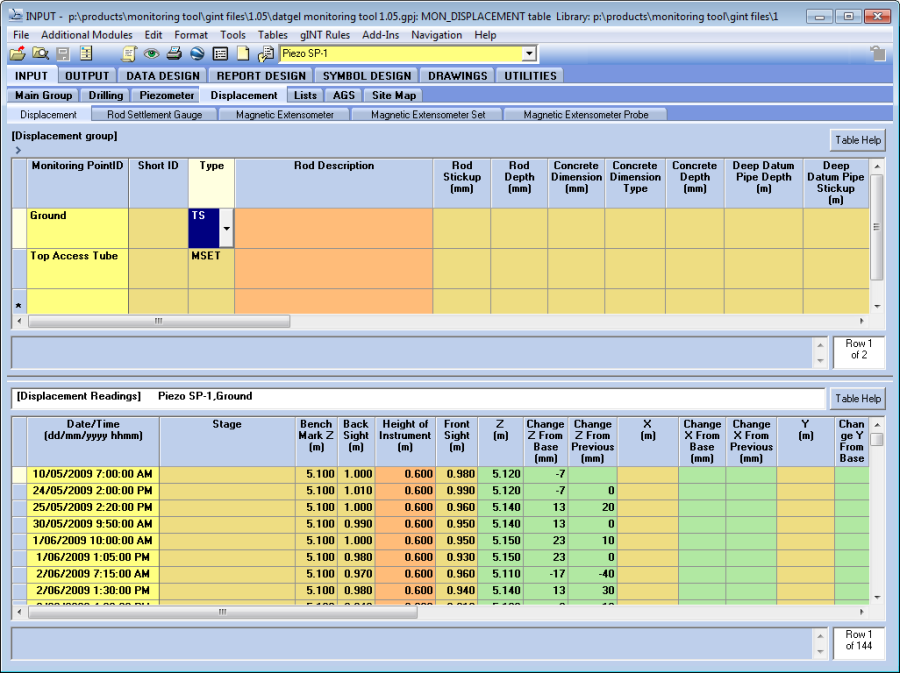
By checking the Use_Top_Access_Tube_Elevation field, the Water Elevation value is calculated by using the Z field value on the Displacement (lower) table that was recorded at the most closely corresponding Date/Time to the monitoring result.
If the Use Top_Access_Tube_Elevation field on the Piezometer (upper) table is unchecked, the value in the Elevation_Reference_Point field is used to calculate the Water_Elevation field.
Vibrating Wire Piezometer Readings
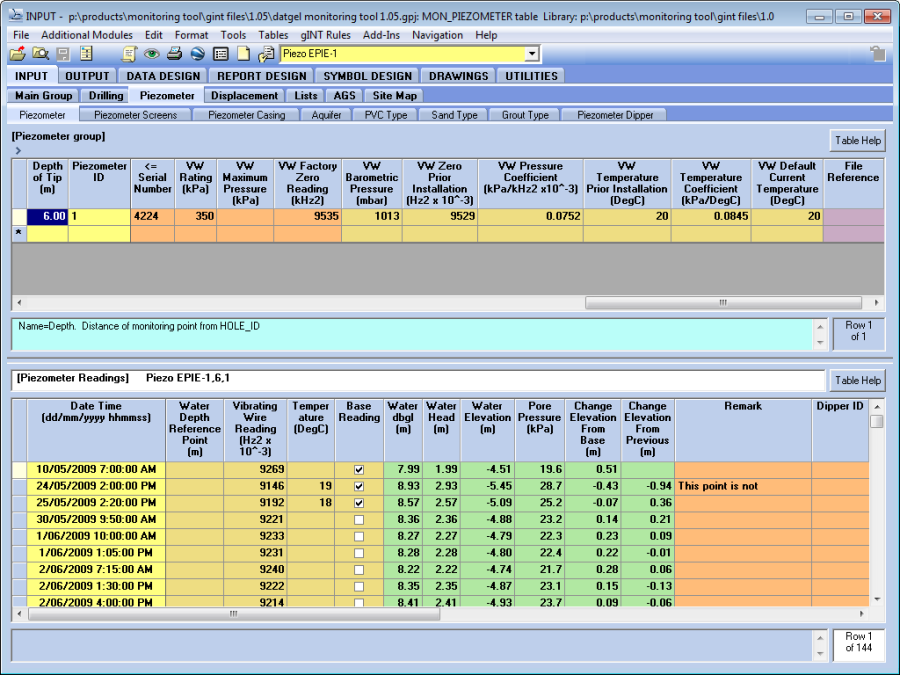
In addition to the steps detailed in Section 3.1 the Type should be set as EPIE and the remaining Vibrating Wire Fields on the Piezometer (upper) table should be completed, as illustrated below:

Where:
VW Zero Prior Installation = F0
VW Pressure Coefficient = CP
VW Temperature Prior Installation= T0
VW Temperature Coefficient=CT
VW Default Current Temperature=T1
The VW Default Current Temperature value is only used in the vibrating wire calculation if a Temperature reading has not been recorded on the Piezometer (lower) table.
The following formula is used to calculate the Pore Pressure for vibrating wire piezometers:
P=F0 - F1 ∙ Cp + T1 - T0 ∙ CT
Where:
P=Pressure (kPa)
F0=Zero reading prior to installation (Hz2 x 10-3)
F1=Current piezometer reading (Hz2 x 10-3)
CP=Pressure coefficient (kPa / Hz2 x 10-3)
CT=Temperature Coefficient (kPa / °C)
T1=Current temperature reading (°C)
T0=Zero temperature reading prior to installation (°C)
Each Vibrating_Wire_Reading (F1) and the Temperature (T1) record should then be recorded on the Piezometer (lower) table.
Reference Tables
This group of tables contains standard information that is referenced by the other Piezometer tables. It can be edited to suit the needs of an individual project and, if it is incorporated into your data template, the information will available in each new project file that is cloned from the new data template.
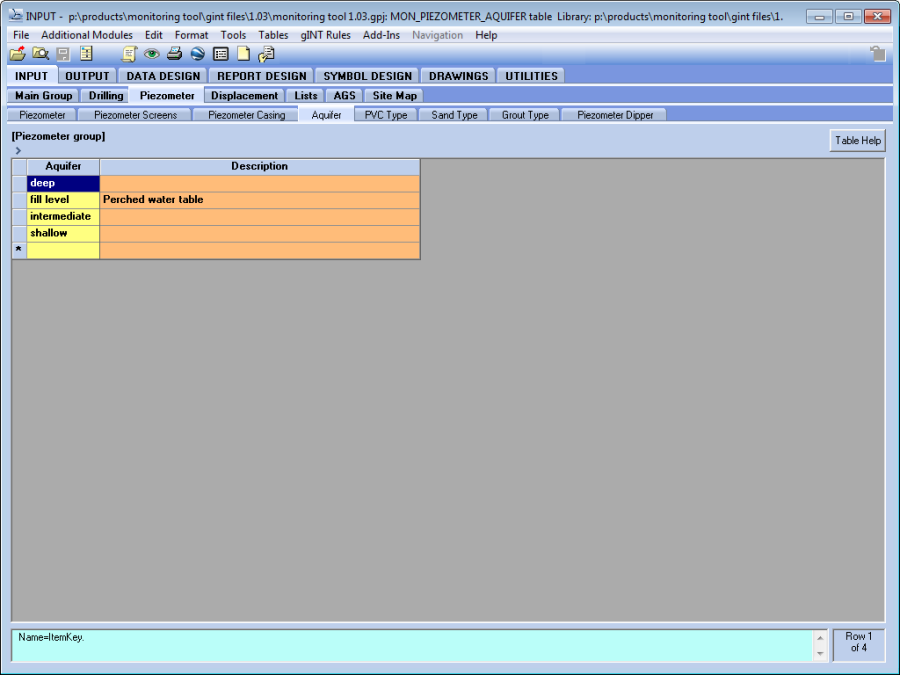
Aquifers
The Aquifer table is used to record the details of an aquifer that may have been encountered on a particular project. The name given to the aquifer can then be picked on the Piezometer_Screens table.
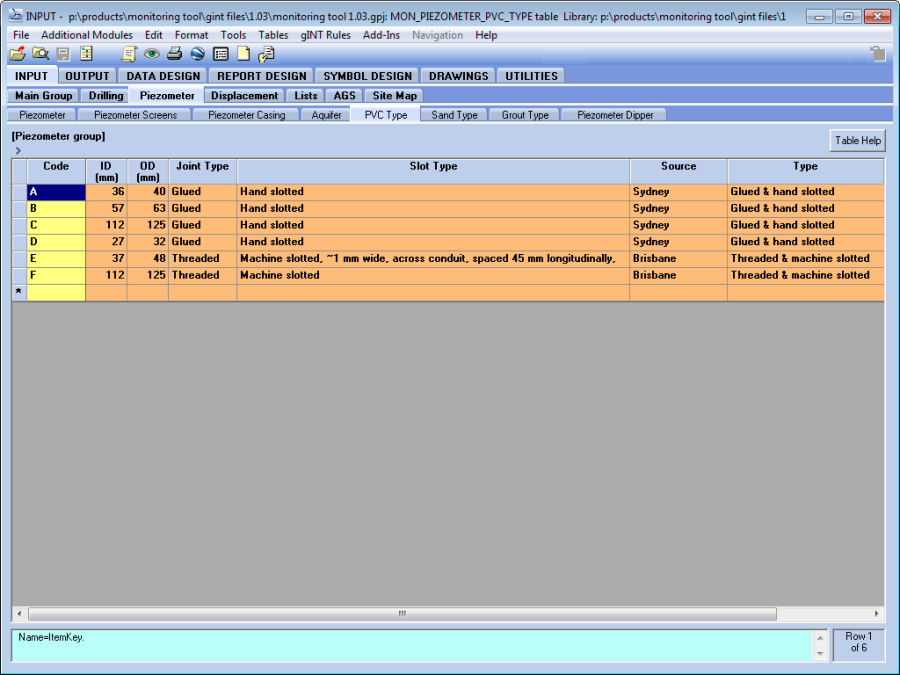
PVC Type
The PVC_Type table is used to define a Code and the associated metadata for that type of PVC pipe used in an installation. The Code can then be picked on the Piezometer_Screens table.
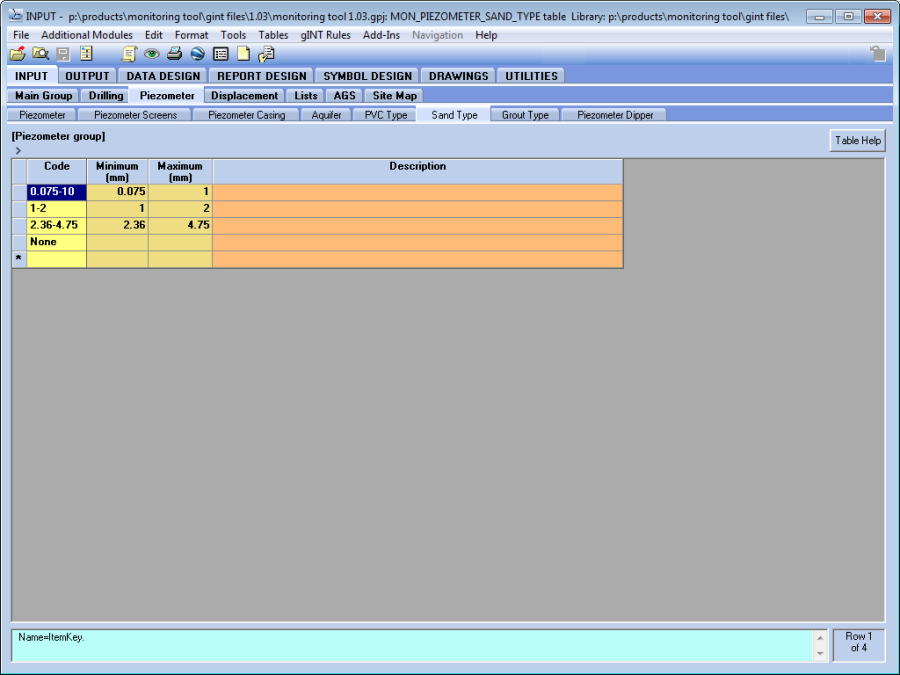
Sand Type
The Sand_Type table is used to define a Code and the associated metadata for each type of sand used in the backfill of the installation. The Code can then be picked on the Piezometer_Screens table.
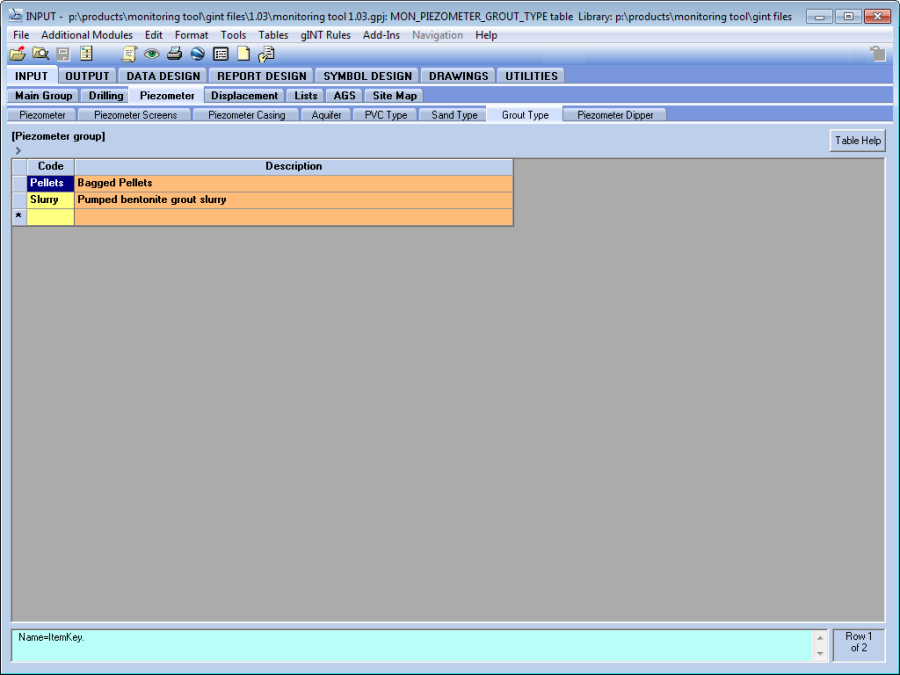
Grout Type
The Grout_Type table is used to define a Code and the associated metadata for each type of grout used in the backfill of the installation. The Code can then be picked on the Backfill table.
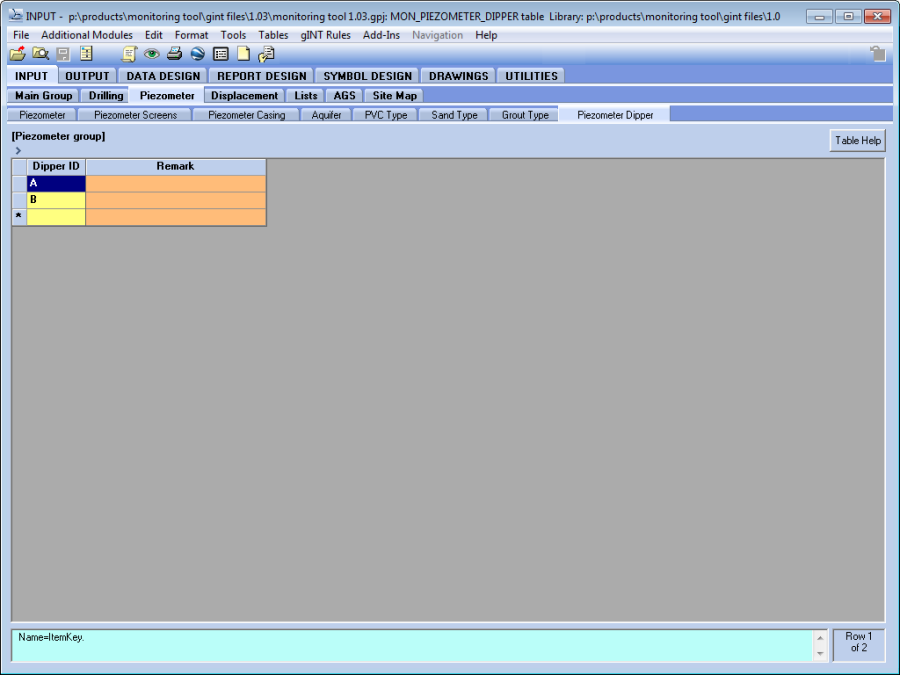
Piezometer Dipper
The Piezometer_Dipper table is used to define a Code and the associated metadata for each piezometer dipper used to monitor the installation. The Code can then be picked on the Piezometer_Readings table.
Output
Output Options
In addition to the options in the Monitoring Projects Options table and in the Monitoring Point Options table, you can select which of the groundwater monitoring results you want to display on the included log reports by checking the Display_on_Log field.
The Show_Surface_Completion allows the user to show the surface completion (check the box) or not (uncheck the box). The type of Surface Completion is stored in the field Surface_Completion on Point table.
Output Reports
Logs | MON PIEZOMETER INSTALLATION LOG
Logs | MON PIEZOMETER GRAPH COLUMN (to be printed with MON PIEZOMETER CONST. DRILL WL VS T - W)*
Graphic Table | MON PIEZOMETER READINGS
Graphs | MON HYDROGRAPH A3L
Graphs | MON HYDROGRAPH A4L
Graphs | MON HYDROGRAPH A4P
Graphs | MON PIEZOMETER FILL VERSUS TIME PLOT
Graphs | MON PIEZOMETER VERSUS TIME PLOT
Graphs | MON PIEZOMETER CONST. DRILL WL VS T – W
Graphs | MON PIEZOMETER CONST. DRILL WL VS T – P (to be printed with MON PIEZOMETER CONST. DRILL WL VS T – W)*
Graphs | MON PIEZOMETER CONST. DRILL WL VS T – D (to be printed with MON PIEZOMETER CONST. DRILL WL VS T – W)*
Graphic Table | MON PIEZOMETER READINGS FIELD SHEET
Some of this reports have been designed to be printed with other reports using Datgel Output Tool (recommended) or the Overlapping option in report properties.
On this page: