Classification Lab Testing
Moisture Content
Supported Test Methods
Standard | Description |
|---|---|
ASTM D 2216-98 | Water (moisture) content of soil and rock by mass |
BS1377-2:1990:3.2 | Moisture content |
ISO/TS 197892-1:2004 | Determination of the water content |
Input
Lab-Class | Moisture Content
To calculate the moisture content, you must first select the standard from the Test_Method field on the Moisture_Content table that the specimen is being tested against. Once selected, click Save and the necessary data entry fields will be automatically highlighted to assist you in entering the relevant data for the selected test method.
Enter the test data in the data entry fields and click Save, Ctrl+S or change table to initiate the calculation. The values will be calculated automatically and the result will be displayed in the calculated fields.
- You may admit the Mass Container field
- Fluid content is relevant to BS1377 if the presence of dissolved salts in saline water gives an incorrect value of moisture content. Fluid_Content will be calculated once the Portion_Mass_Salt_(ppm) or the Mass_per_Volume Salt (g/L) fields were populated
Output
- Graphic Text Doc | L CS MOISTURE CONTENT
Soil Density
Supported Test Methods
Standard | Description |
|---|---|
BS1377-2:1990:7.2 | Determination of density - Linear measurement method |
BS1377-2:1990:7.3 | Determination of density - Immersion in water method |
BS1377-2:1990:7.4 | Determination of density - Water displacement method |
ISO/TS 17892-1:2004 5.1 | Determination of bulk density - Linear measurement method |
ISO/TS 17892-1:2004 5.2 | Determination of bulk density - Immersion in water method |
ISO/TS 17892-1:2004 5.3 | Determination of bulk density - Water displacement method |
Input
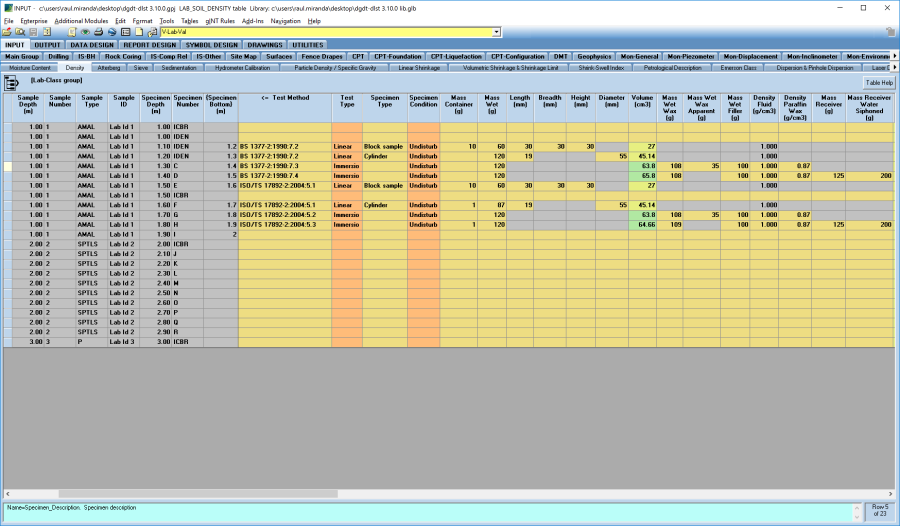
Lab-Class | Density
To calculate the soil density, you must first select the standard from the Test_Method field on the Density table that the specimen is being tested against, and then select the Test Type, and the Specimen Type. Once selected, click Save and the necessary data entry fields will be automatically highlighted to assist you in entering the relevant data for the selected test method.
Enter the test data in the data entry fields and click Save, CTRL+S or change table to initiate the calculation. The values will be calculated automatically and the result will be displayed in the calculated fields.
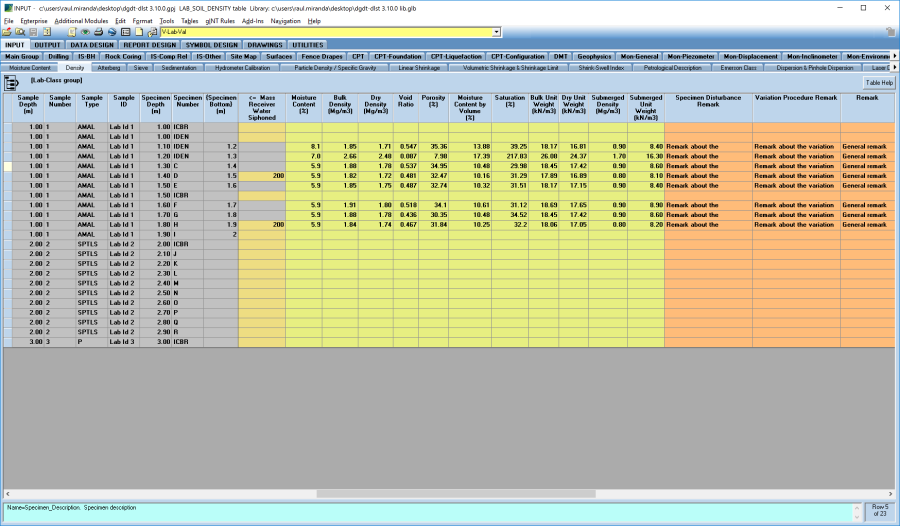
The Bulk_Density and the Dry_Density will be calculated. The calculation of Dry_Density is dependent on a Moisture_Content result existing for the same specimen.
In addition, the following parameters will be calculated in the same Density table: Void_Ratio, Porosity, Moisture_Content_by_Volume, Saturation, Bulk_Unit_Weight, Submerged_Density and Submerged_Unit_Weight.
Output
- Graphic Text Report | L CS DENSITY
- Graphic Table Report | L CS DENSITY MULTI
- Histogram Report | A L CS R BULK DENSITY
- Histogram Report | A L CS R DRY DENSITY
Atterberg
Supported Test Methods
Standard | Description |
|---|---|
BS1377-2:1990:4.3 | Determination of the liquid limit - cone penetrometer method |
BS1377-2:1990:4.4 | Determination of the liquid limit - one point cone penetrometer method |
BS1377-2:1990:4.5 | Determination of the liquid limit - Casagrande apparatus method |
BS1377-2:1990:4.6 | Determination of the liquid limit - one point Casagrande apparatus method |
ASTM D 4318-00 A | Liquid Limit, Plastic Limit and Plasticity Index of Soils – Method A |
ASTM D 4318-00 B | Liquid Limit, Plastic Limit and Plasticity Index of Soils – Method B |
ISO/TS 17892-12:2004 | Determination of Atterberg Limits |
Input
Lab-Class | Atterberg
To calculate the Atterberg values of a specimen, you must first select the standard from the Liquid_Limit_Test_Method field on the Atterberg (upper) table that the specimen is being tested against. Once selected, click Save and the necessary data entry fields will be automatically highlighted to assist you in entering the relevant data in the Atterberg (upper) and Atterberg (lower) table for the selected test method.
General Data Entry
Enter the test data in the data entry fields on the Atterberg (lower) table for each test and when you change table or select save, the values will be calculated automatically and the result will be displayed in the calculated fields.
Rows without data in Cone_Penetration or Number_of_Blows fields will be used to determine the Plastic Limit value. The Plastic_Limit is calculated using the two closest values of moisture content and making the average of them.
The following examples show the required fields in the lower table for each selected standard.
Atterberg Readings – BS1377-2:1990:4:3
Atterberg Readings – BS1377-2:1990:4:4
Atterberg Readings – BS1377-2:1990:4:5
Atterberg Readings – BS1377-2:1990:4:6
Atterberg Readings – ASTM D 4318-00 A
Atterberg Readings for ASTM D 4318-00 B
Atterberg Readings for ISO/TS 17892-12:2004
Percent Passing the 425µm Sieve
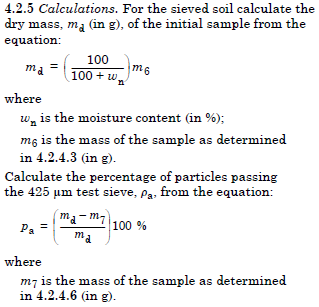
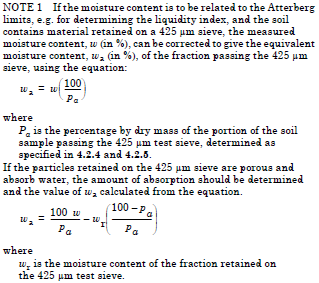
The percent passing 0.425 mm is calculated as described in the following excerpt from BS 1377-2:1990:4.2.5, or taken from a Sieve_Readings table for the same specimen.
To determine the percentage passing the 425µm sieve using the BS 1377-23:1990 method, the following options may be used:
- Define the moisture content for a specimen with the same depth on the Moisture Content table and select the Specimen Preparation method on the Atterberg (upper) table as 'Passing 0.425mm sieve at NMC'. This is the wa value.
- For non porous soils, define the moisture content for a specimen with the same depth on the Moisture Content table and select the Specimen Preparation method on the Moisture Content table as 'As received' or 'undisturbed'. Then wa is calculated from dw and pa.
- For porous soils, define the moisture content for a specimen with the same depth on the Moisture Content table and select the Specimen Preparation method on the Moisture Content table as 'As received', (wr). Select the Specimen_Preparation method on the Atterberg table as Retained on 0.425 mm sieve at NMC' and check the box in the Porous_Material field. Then wa is calculated from w, wr and pa.
Liquidity Index Calculation
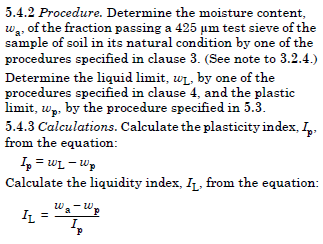
In order to calculate the liquidity index (IL) the moisture content of the fraction passing 0.425 mm (wa), must be defined as described in the following BS 1377-2:1990 excerpts.
Output
- Graph Report | L CS ATTERBEG LIQUID LIMIT CONE LOG-LIN
- Graph Report | L CS ATTERBEG LIQUID LIMIT CASA LIN-LOG
- Graph Report | L CS ATTERBEG LIQUID LIMIT CONE LIN-LIN
- Graphic Table Report | L CS ATTERBERG MULTI
- Graphic Text Report | L CS ATTERBERG
Sieve
Supported Test Methods
Standard | Description |
|---|---|
ASTM C 136-06 | Sieve analysis of fine and coarse grained aggregates |
ASTM D 422-63 | Particle size analysis of soils |
BS1377-2:1990:9.2 | Determination of particle size distribution - wet sieve method |
BS1377-2:1990:9.3 | Determination of particle size distribution - dry sieve method |
BS812-103:1985:7.2 | Particle size distribution - washing and sieving method |
BS812-103:1985:7.3 | Particle size distribution - dry sieving method |
ISO/TS 17892-4:2004 5.2 | Determination of particle size distribution - Sieving. |
Input
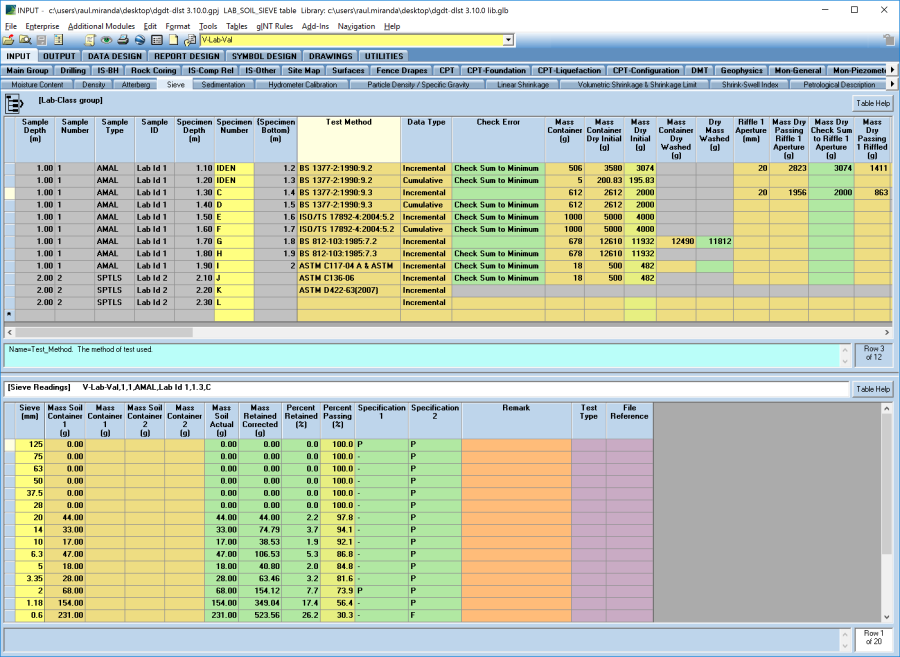
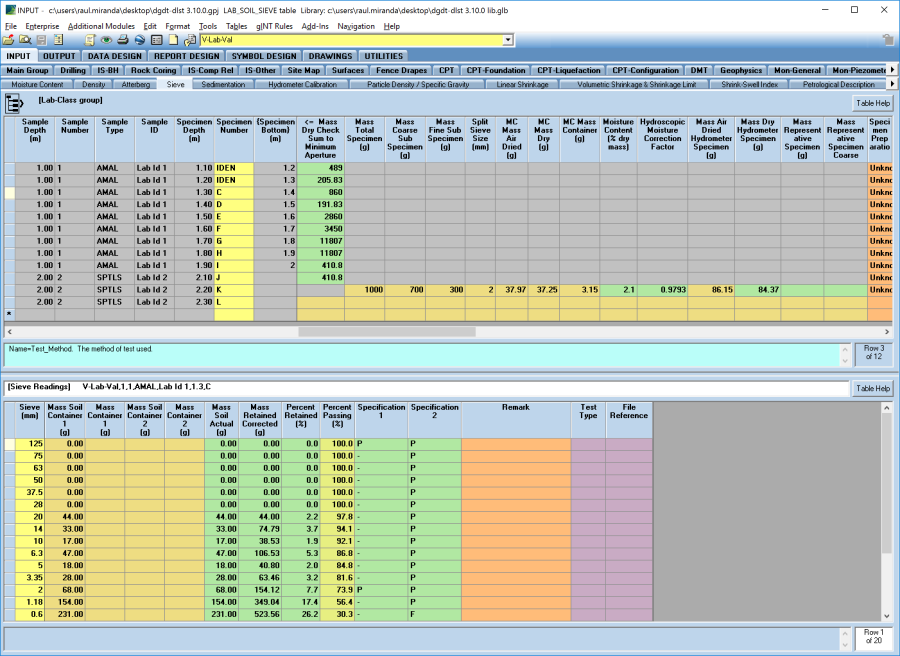
Lab-Class | Sieve
To calculate the particle size distribution of a specimen, you must first select the standard from the Test_Method field on the Sieve (upper) table that the specimen is being tested against. Once selected, click Save and the necessary data entry fields will be automatically highlighted to assist you in entering the relevant data for the selected test method. Specify in the Data_Type field if your data is from a Cumulative or an Incremental test
Enter the test data in the data entry fields on the Sieve (lower) table for each sieve size and when you change table or select save, the PSD values will be calculated automatically and the result will be displayed in the calculated fields.
Output
- Graph Report | A L CS PSD 10 PER PAGE SUMMARY
- Graph Report | A L CS PSD 20 PER PAGE SUMMARY
- Graph Report | A L CS PSD ENVELOPE SUMMARY
- Graph Report | L CS PSD ASTM
- Graph Report | L CS PSD BSI
- Histogram Report | A L CS PSD FINES CONTENT
Sedimentation by Hydrometer
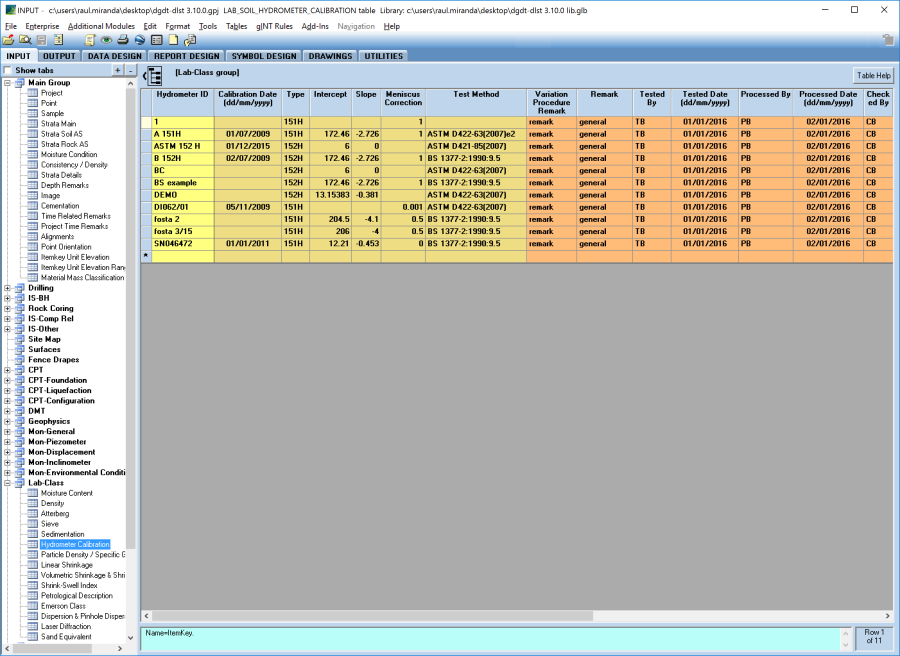
Hydrometer Calibration
Lab-Class | Hydrometer Calibration
Complete the data entry fields and enter any other associated metadata as required. The value entered in the Hydrometer_ID field will then be used in the lookup list in the Hydrometer_ID field on the Sedimentation table.
Supported Test Methods
Standard | Description |
|---|---|
ASTM D 422-63 | Particle size analysis of soils |
BS1377-2:1990:9.5 | Determination of particle size distribution – sedimentation by the hydrometer method |
ISO/TS 17892-4:2004:5.3 | Determination of particle size distribution – Hydrometer |
Input
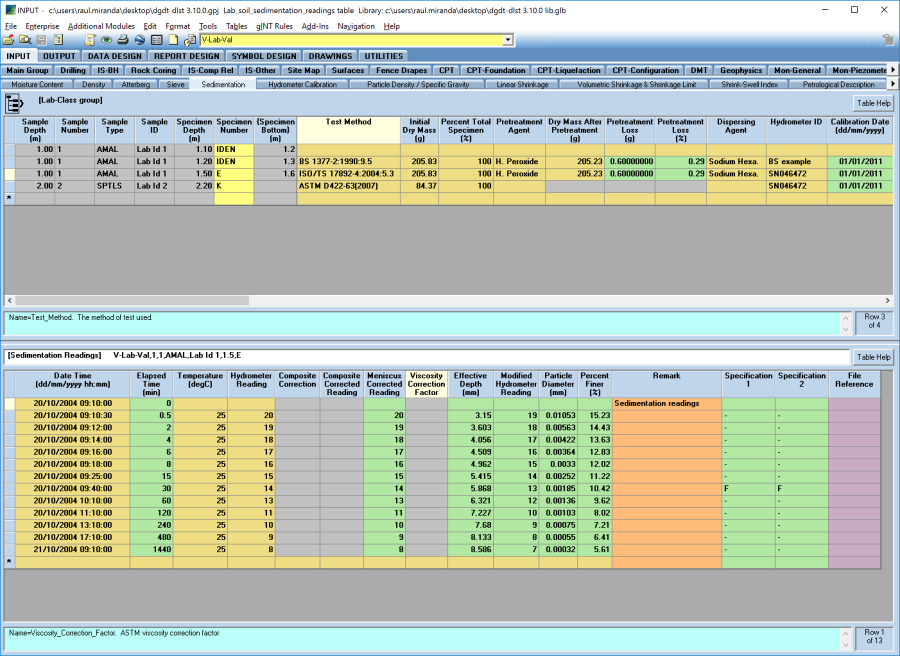
Lab-Class | Sedimentation
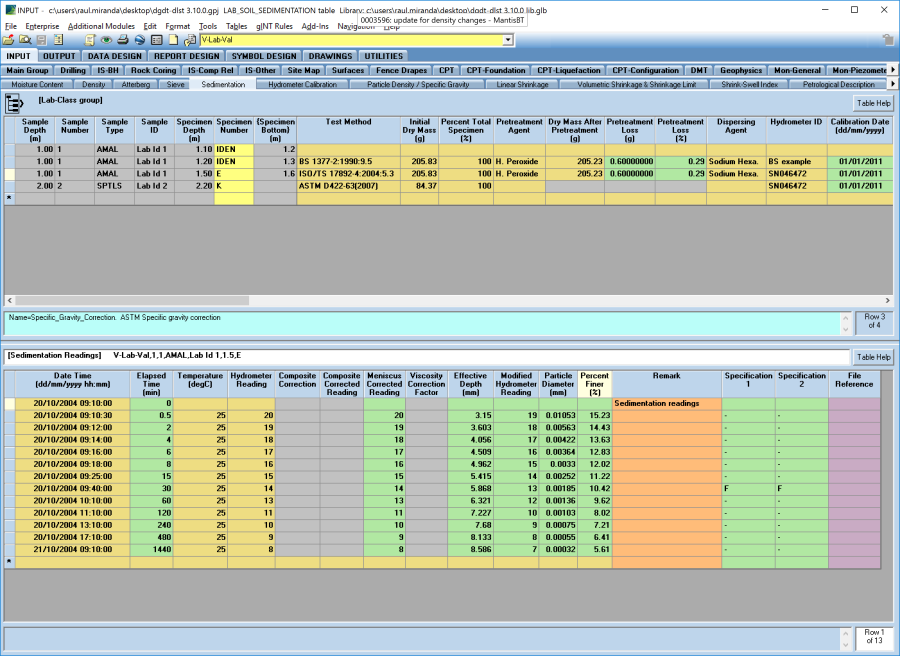
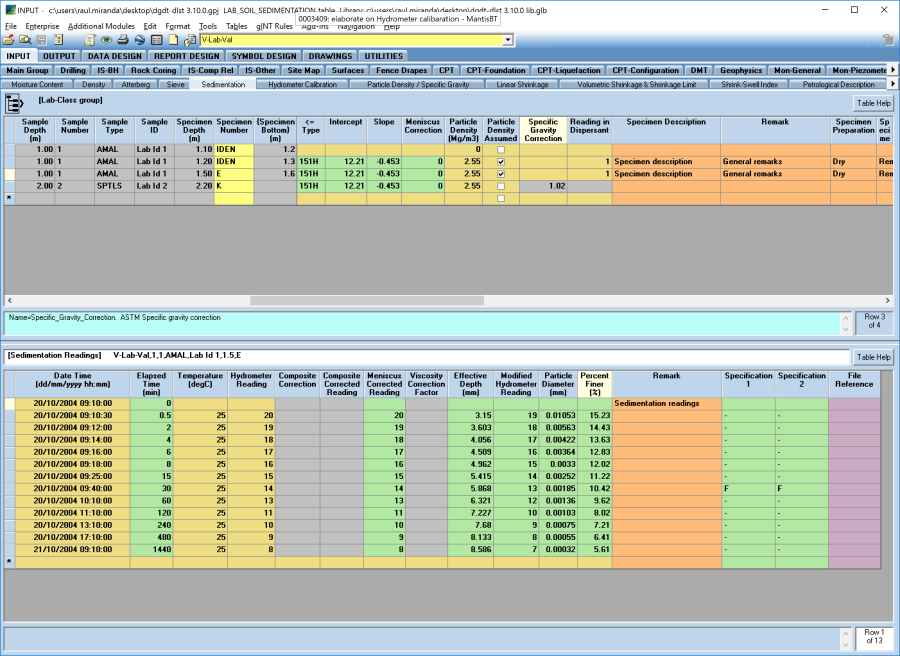
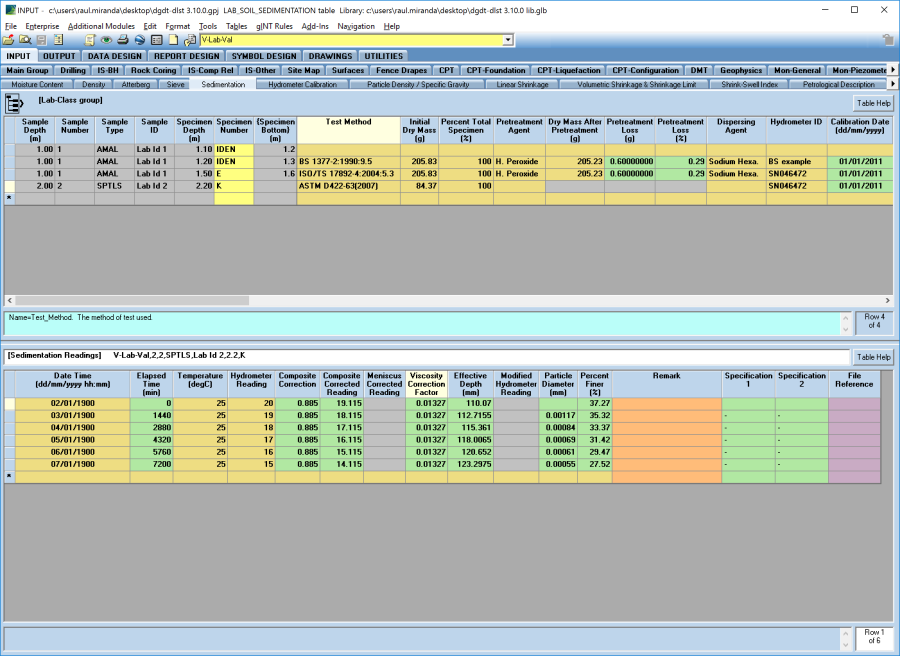
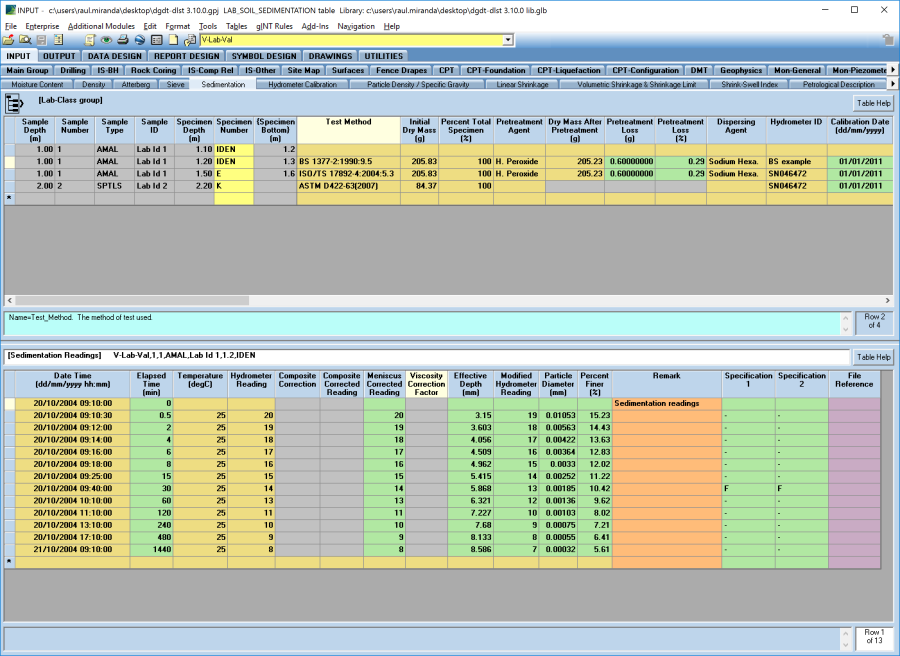
To calculate the particle size distribution of a specimen, you must first select the standard from the Test_Method field on the Sedimentation (upper) table that the specimen is being tested against. Once selected, click Save and the necessary data entry fields will be automatically highlighted to assist you in entering the relevant data in the Sedimentation (upper) table for the selected test method.
Enter the test data in the data entry fields on the Sedimentation (lower) table for each reading and when you change table or select save, the values will be calculated automatically and the result will be displayed in the calculated fields.
The following examples show the required fields in the lower table for each selected standard.
Sedimentation by Hydrometer Readings – ASTM D 422-63
Sedimentation by Hydrometer Readings – BS1377-2:1990:9.5
Sedimentation by Hydrometer Readings – ISO/TS 17892-4:2004:5.3
Output
- Graph Report | A L CS PSD 10 PER PAGE SUMMARY
- Graph Report | A L CS PSD 20 PER PAGE SUMMARY
- Graph Report | A L CS PSD ENVELOPE SUMMARY
- Graph Report | L CS PSD ASTM
- Graph Report | L CS PSD BSI
- Histogram Report | A L CS PSD FINES CONTENT
Particle Density / Specific Gravity
Supported Test Methods
Standard | Description |
|---|---|
ASTM D 854-06 | Specific Gravity of Soil Solids by Water Pycnometer |
BS1377-2:1990:8.2 | Determination of particle density - Gas Jar Method |
BS1377-2:1990:8.3 | Determination of particle density - Small Pyknometer Method |
BS1377-2:1990:8.4 | Determination of particle density - Large Pyknometer Method |
ISO/TS 17892-3:2004 A | Determination of particle density – Pycnometer method. Method A: Oven-dried spec. |
ISO/TS 17892-3:2004 B | Determination of particle density – Pycnometer method. Method B: Moist specimens |
Input
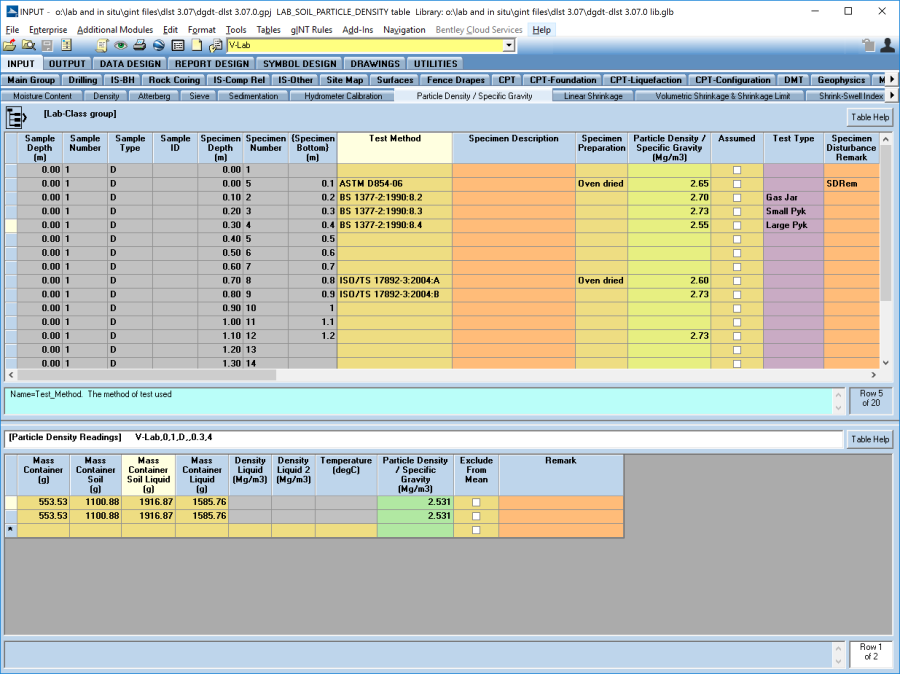
Lab-Class | Particle Density / Specific Gravity
To calculate the particle density, you must first select the standard from the Test_Method field on the Particle_Density / Specific_Gravity table that the specimen is being tested against. Once selected, click Save and the necessary data entry fields will be automatically highlighted to assist you in entering the relevant data for the selected test method.
Enter the test data in the data entry fields on the lower table and click Save or Ctrl+S to initiate the calculation and the average will be calculated in the upper table. If however you want to enter an assumed particle density value, check the box in the Assumed field and enter the assumed particle density value in the Particle_Density/Specific_Gravity field.
You may record multiple Particle Density test for the one specimen, and the Mean of each is recorded on the Particle_Density / Specific_Gravity (upper) table. You may exclude a particular test from the mean by checking the Exclude_From_Mean check box in the lower table.
The following examples show the required fields in the lower table for each selected standard.
Particle Density / Specific Gravity Table - ASTM S584-06
Particle Density / Specific Gravity Table – BS 1377-2:1990:8.2
Particle Density / Specific Gravity Table – BS 1377-2:1990:8.3
Particle Density / Specific Gravity Table – BS 1377-2:1990:8.4
Particle Density / Specific Gravity Table – ISO/TS 17892-3:2004 A
Particle Density / Specific Gravity Table – ISO/TS 17892-3:2004 B
Output
- Graphic Text Report | L CS PARTICLE DENSITY
- Graphic Table Report | L CS PARTICLE DENSITY
- Graphic Table Report | L CS PARTICLE DENSITY MULT
Linear Shrinkage
Supported Test Methods
Standard | Description |
|---|---|
BS1377-2:1990:6.5 | Linear shrinkage |
Input
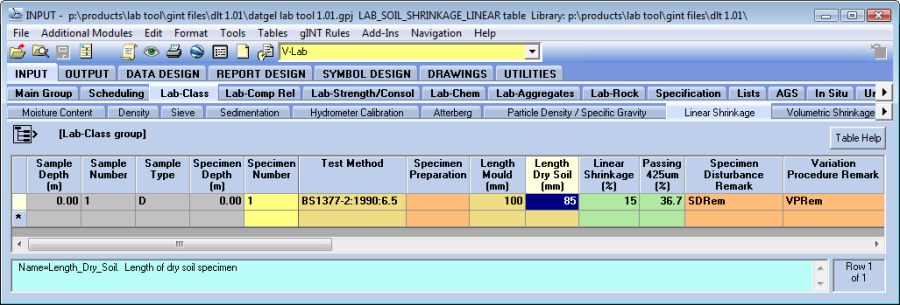
Lab- Class | Linear Shrinkage
Enter the test data in the data entry fields and click Save, Ctrl+S or change the row to initiate the calculation. The values will be calculated automatically and the result will be displayed in the calculated fields.
Output
- Graphic Text Report | L CS SHRINKAGE LINEAR
- Graphic Table Report | L CS SHRINKAGE LINEAR MULT
Volumetric Shrinkage
Supported Test Methods
Standard | Description |
|---|---|
ASTM D 4943-08 | Shrinkage factors of soils by the wax method |
BS1377-2:1990:6.3 | Volumetric shrinkage (definitive method) |
BS1377-2:1990:6.4 | Volumetric shrinkage (subsidiary method) |
Input
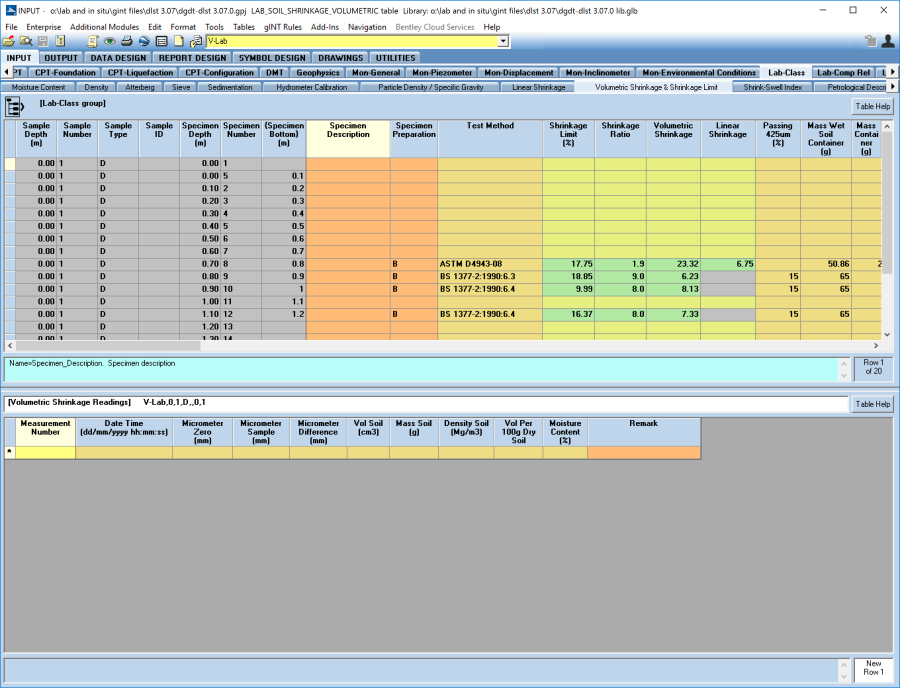
Lab- Class | Volumetric Shrinkage
To calculate the volumetric shrinkage, you must first select the standard from the Test_Method field on the Volumetric_Shrinkage (upper) table that the specimen is being tested against. Once selected, click Save and the necessary data entry fields will be automatically highlighted to assist you in entering the relevant data for the selected test method.
Enter the test data in the data entry fields on the Volumetric_Shrinkage_Readings (lower) table and click Save or Ctrl+S to initiate the calculation. The values will be calculated automatically and the result will be displayed in the calculated fields.
Volumetric Shrinkage Readings (lower) table is only needed if BS 1377-2:1990:6.3 or BS 1377-2:1990:6.4 is selected.
The following examples show the required fields in the lower table for each selected standard.
Volumetric Shrinkage Table (lower) - BS 1377-2:1990:6.3
Volumetric Shrinkage Table (lower) - BS 1377-2:1990:6.4
Output
- Graph Report | L CS SHRINKAGE VOLUMETRIC CURVE
- Graphic Text Report | L CS SHRINKAGE VOLUMETRIC
Emerson Class
Input
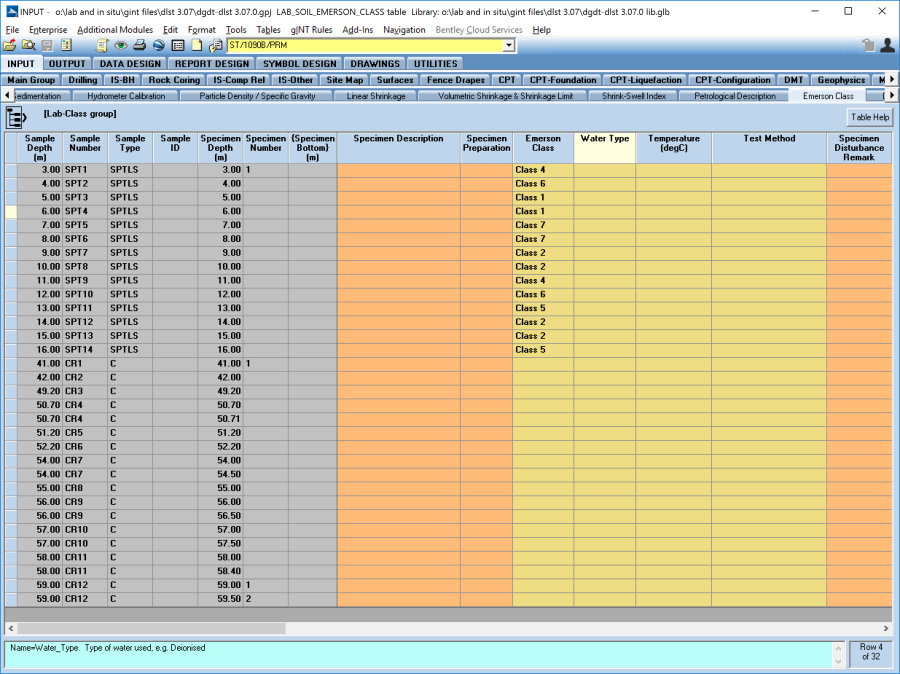
Lab-Class | Emerson Class
Simply choose the value from the drop down list in the Emerson_Class field in the Emerson_Class table for the selected specimen. Data storage only, no calculations.
Output
At the time of writing, there are no reports available for Emerson Class test.
Laser Diffraction PSD
Input
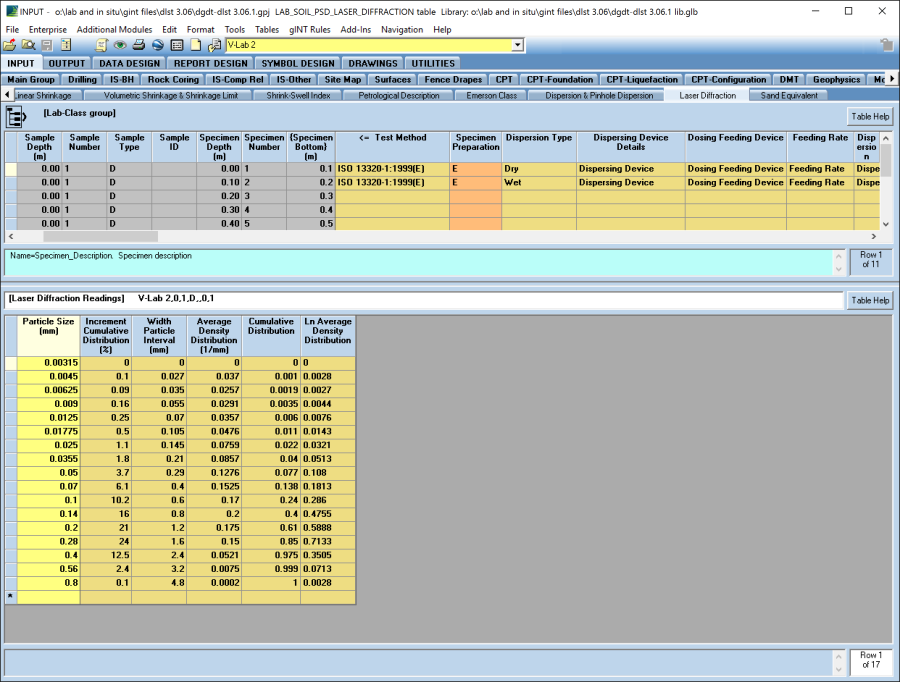
Lab-Class | Laser Diffraction
Simply enter the values into the Laser_Diffraction (upper) table and in the Laser_Diffraction_Readings (lower) table. Data storage only, no calculations.
Output
- Graph Report | L CS PSD LASER DIFFRACTION

