Soil Behaviour Type
Overview
Seven unique SBT methods are included in the library file, and users may configure additional methods stored in the library or the project file.
The order of priority for SBT selection used by the calculation is:
- CPT_POINT_PARAMTERS.Project_Soil_Class_Method_#
- CPT_POINT_PARAMTERS.Soil_Class_Method_#
- CPT_PROJECT_PARAMTERS.Project_Soil_Class Method#
- CPT_PROJECT_PARAMTERS.Soil_Class_Method_#
Preconfigured in Library
The CPT Tool is supplied with nine material type interpretation methods:
- Begemann 1965
- Eslami Fellenius 1997
- Ramsey 2002
- Robertson 1990
- Robertson 1990 Extrapolated (axis extrapolated out one order of magnitude)
- Robertson et al. 1986
- Robertson et al. 1986 qc vs. Rf (Applicable when u_2 isn't measured)
- Schmertmann 1978
- Schneider et al. 2008 (defined by formula in paper's table 6)
Additional methods may be defined by users in the DG_CPT* library tables. See section Creating a New Soil Behaviour Type.The CPT_DATA table allows for two methods to be defined. The methods are set on the CPT_PROJECT_PARAMETERS and the CPT_POINT_PARAMETERS tables.If the interpretation is done using 2 graphs, then the first single (not a list of numbers) result is used as the overall material classification.
Examples:
- If Soil Zone 1 Graph 1 = 5 and Soil Zone 1 Graph 2 = 6, then Soil Class Number 1 will = 5
- If Soil Zone 1 Graph 1 = 9,10,11,12 and Soil Zone 1 Graph 2 = 9, then Soil Class Number 1 will = 9
If a point lies on the border of two zones, then the soil zone will be an appended string of both numbers, e.g. "9,10". The material type graph reports will print a black dot for these dual points.If the graph parameters are not within the range of the graph, then the Description field is set to "No Match".If the X and/or Y axes of the graph are in a particular measurement unit (e.g. MPa), then the unit must be defined in the Graph_#_Parameter_Field_X_Unit and Graph_#_Parameter_Field_Y_Unit fields in the DG_CPT_SOIL_CLASS_METHOD table respectively. The value from the field reference defined in Graph_#_Parameter_Field_X or Graph_#_Parameter_Field_Y is converted from the unit it is currently in to the unit defined in the unit specified in the Graph_#_Parameter_Field_X_Unit and Graph_#_Parameter_Field_Y_Unit fields before determining which zone the value lies in.
Creating a New Soil Behaviour Type in a Library
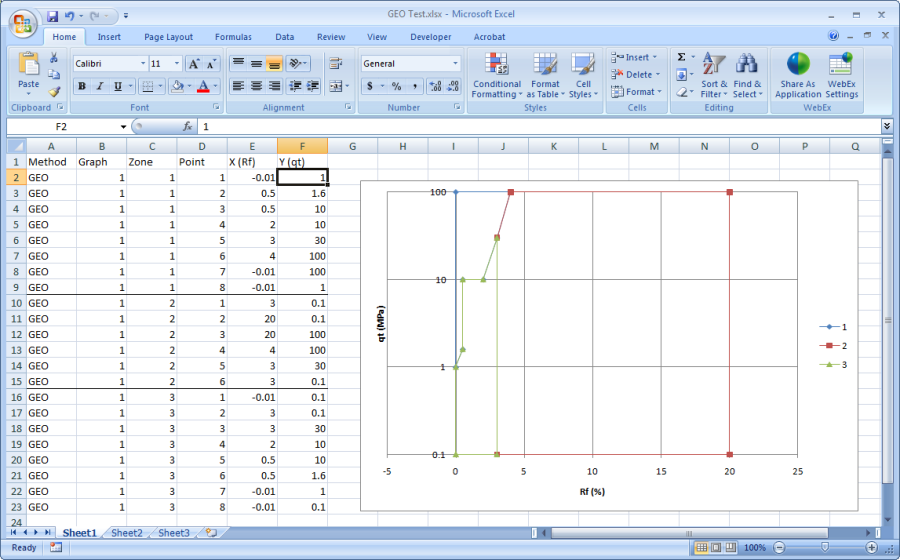
Creating a new soil behaviour type involves adding data to library tables, and creating Graph reports. As an example a new SBT method titled GEO will be added.
- Create the points and a graph for the new method in Excel
- Ensure there are no gaps and points of neighbouring zones coincide
- The polygons must be closed, i.e. the first point is the same as the last point
- It doesn't matter if the lines progress clockwise or anti-clockwise
- DG_CPT_SOIL_CLASS_METHOD
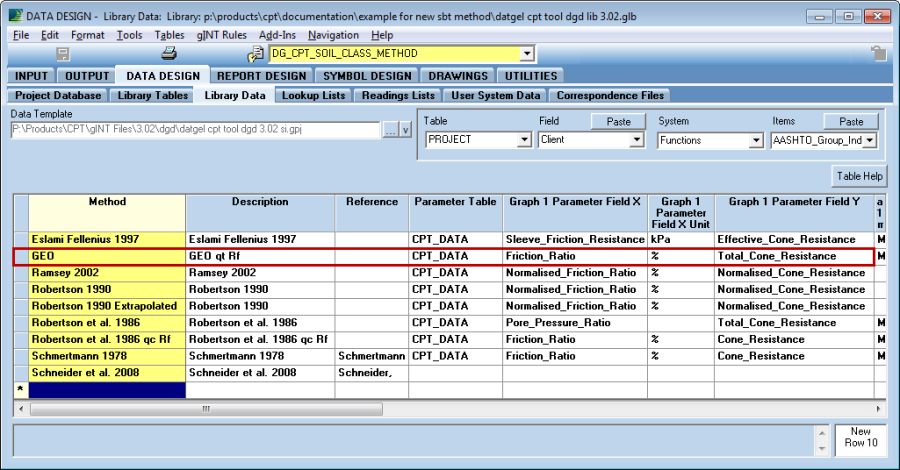
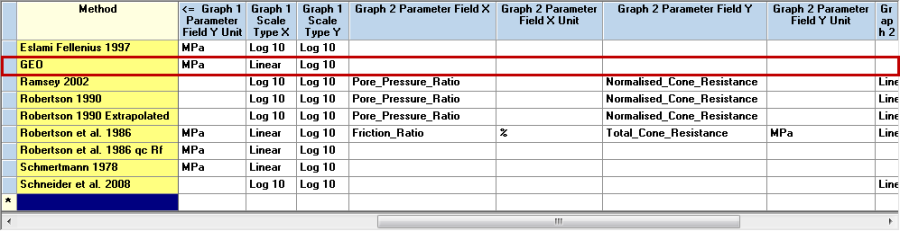
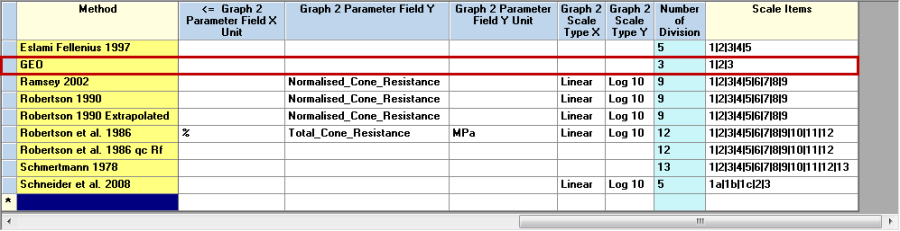
- Graph 2 is optional
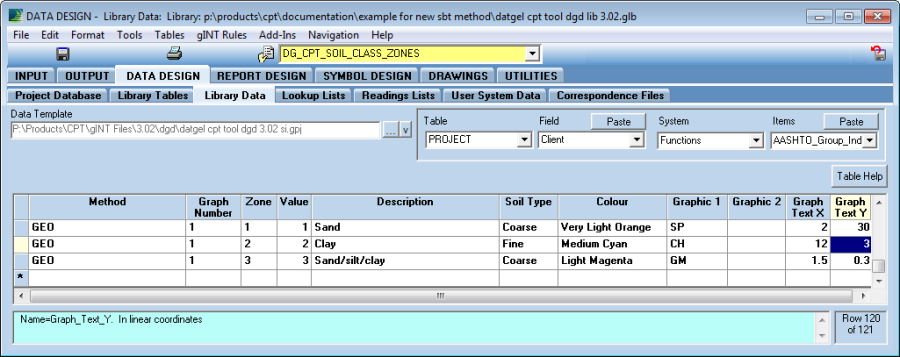
- DG_CPT_SOIL_CLASS_ZONES
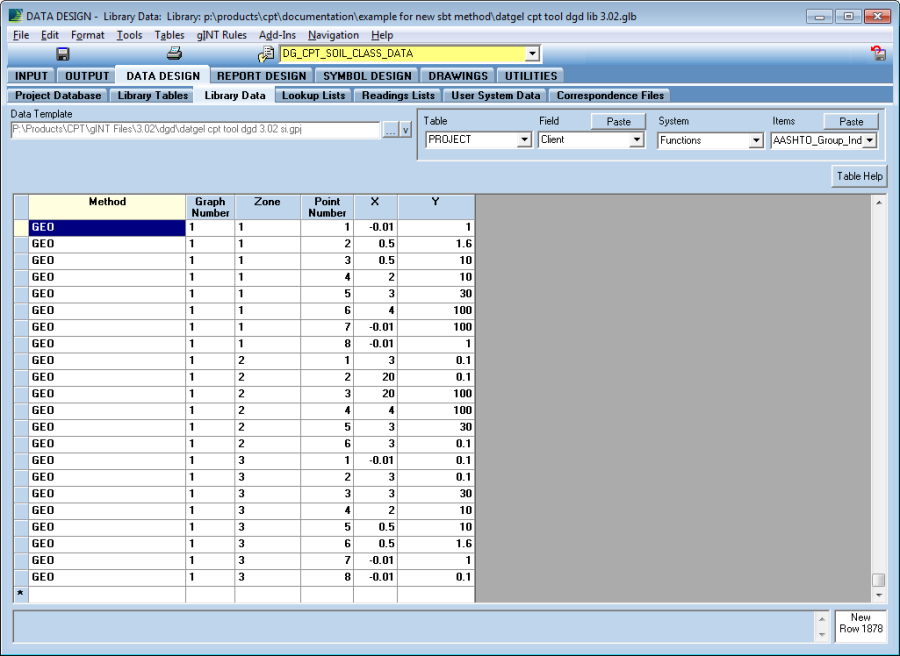
- DG_CPT_SOIL_CLASS_DATA
- You may now return to INPUT, set the new SBT method on the Project or Point Parameters tables, and calculate a CPT. The results will now print on log reports.
- Now create a new graph report. This can be most efficiently done by copying the pre-existing Graph report titled CPT ROBERTSON ET AL. 1986 QT VS. RF. Use the command File > Copy page... and name the new report CPT GEO QT VS. RF.
Now open the report properties and make the following changes
Property New Value General Tab Description Soil behaviour type classification graph - GEO, total cone resistance (qt) versus friction ratio (Rf) Report Variable – Soil Class Method <<Let(A="GEO")>><<Get(A)>> Report Variable – Graph Number <<Calc(1)>> Report Variable – Default Title GEO qt vs. Rf - [[PointID]] Report Variable – Y Axis Unit Conversion Factor <<Let(SourceField = <<CPT_DATA.Total_Cone_Resistance>>)>>_
<<Let(SourceUnit = <<FieldUnits(<<CPT_DATA.Total_Cone_Resistance>>)>>)>>_
<<Let(TargetUnit = <<Report Var.Y Axis Unit>>)>>_
<<User System Data.DG Com Unit Conversion Factor>>Dependent Tab Data Expression 1 <<Calc(<<Report Var.Y Axis Unit Conversion Factor>> * <<CPT_DATA.Total_Cone_Resistance>>)>> Minimum Value <<Let(SourceUnit = "MPa")>>_
<<Let(TargetUnit = <<Report Var.Y Axis Unit>>)>>_
<<Let(UnitConversionFactor = <<User System Data.DG Com Unit Conversion Factor>>)>>_
<<Calc(<<Get(UnitConversionFactor)>> * 0.1)>>Maximum Value <<Let(SourceUnit = "MPa")>>_
<<Let(TargetUnit = <<Report Var.Y Axis Unit>>)>>_
<<Let(UnitConversionFactor = <<User System Data.DG Com Unit Conversion Factor>>)>>_
<<Calc(<<Get(UnitConversionFactor)>> * 100)>>Data Representation Tab > Curves from Equations sub form
Repeat the following for each Zone, incrementing the Zone = # each rowCurve Equation <<Let(Zone = 1)>>_
<<IndDepList>>_
<<SqlList(_
";"_
,_
select [DG_CPT_SOIL_CLASS_DATA].[X] & "," & [DG_CPT_SOIL_CLASS_DATA].[Y] _
from [DG_CPT_SOIL_CLASS_DATA] in '<<LibFileSpec>>'_
where [DG_CPT_SOIL_CLASS_DATA].[Method] = '<<Report Var.Soil Class Method>>' AND _
[DG_CPT_SOIL_CLASS_DATA].[Graph_Number] = '<<Report Var.Graph Number>>' and _
[DG_CPT_SOIL_CLASS_DATA].[Zone] = '<<Get(Zone)>>' _
order by [DG_CPT_SOIL_CLASS_DATA].[Point_Number]_
)>>Number of Points 10 Line Type Solid Line Thickness 0.2 Line Colour Light Blue Override Line/DM Expression Tab Data marker Colour Expression 1 <<User System Data.DG CPT SBT Graph 1 DMK Colour>>
When you update the User Report Variable in the GENERAL tab, ensure that you entered correct Soil Class Method name (e.g. GEO). This will make sure all the user system data are referring to the right method.
The unit conversion feature Unit Conversion Tool has been applied to expressions Data Expression, Minimum Value and Maximum Value.- You may now move to OUTPUT and preview the report.
Project Soil Behaviour Type
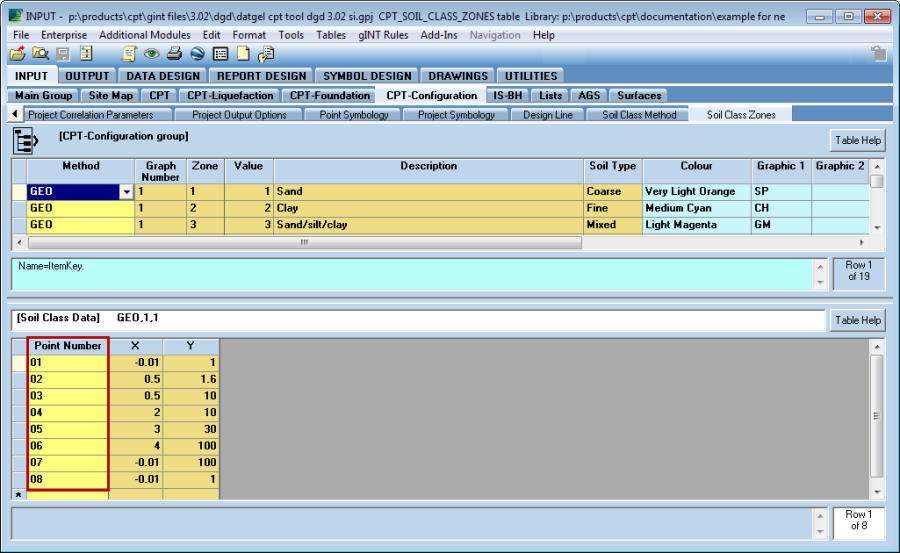
Project specific Soil Behaviour Type configurations may be stored in the project database. The relevant project tables are within the CPT-Configuration table group:
- CPT_SOIL_CLASS_DATA Soil Class Data
- CPT_SOIL_CLASS_METHOD Soil Class Method
- CPT_SOIL_CLASS_ZONES Soil Class Zones
The process of defining a Project SBT is very similar to defining a Library SBT. In the project file you can use split screens and have data relationships between tables, which makes the user interface more intuitive and logical. One major data entry differences is that Point Number on Soil Class Data is a text type field, and it needs data that will order correctly as text, hence enter numbers padded with a zero e.g. 01.
Soil Type 1
CPT_DATA.Soil_Type_1 is referred to by many correlations to define if the material is fine, coarse or mixed. It can be defined based on Soil Behaviour Type 1, or any of the Soil Behaviour Type Index (Ic) columns. The following fields control the calculation:
- CPT_PROJECT_PARAMETERS.Soil_Type_Method
- CPT_PROJECT_PARAMETERS.Soil_Type_Ic_Upper_Bound_Coarse
- CPT_PROJECT_PARAMETERS.Soil_Type_Ic_Lower_Bound_Fine
If an Ic method is selected in Soil_Type_Method the calculation used is: < Ic_Upper_Bound_Coarse => Coarse, >= Ic_Upper_Bound_Coarse and <= Ic_Lower_Bound_Fine => Mixed, > Ic_Lower_Bound_Fine => Fine