Reports
The Output Tool utilises any reports that exist within your gINT library file. Settings defined on the Reports tab take precedence over General tab settings.
Refer to section Report Menu for a definition of each command and tool bar button.
The Report grid columns are:
- Group: A meta data field, can be used as a PDF bookmark or in Replace Text Expression
- Report Type: gINT report Type, e.g. Log
- Report Name: gINT report name, e.g. Non-Cored Borehole
- Remark: A meta data field, can be used as a PDF bookmark or in Replace Text Expression
- Key Set: Combination of key fields, e.g. PointID, or PointID,Depth. The source table for the current report is defined by Output Tool > Reports > Update Reports Captions and Source Table command (see section 2.14 Update Reports Captions and Source Table), or in the source table on the General tab is used as a default.
- User Report Variable: Clicking on the
 will display the native gINT User Report Variable form. You can set the values as required, including the use of Place Holders.
 - Filter: Clicking on the will display the Filter form, configure as required and click OK. The Filter function works in a similar manner as the gINT OUTPUT Filter. The code ensures a space is entered after the operator and before the value with single quotes placed around text and # around dates. (e.g. > 'A', Like 'BH', > #01/01/2009#).
- Range Filter: Clicking on the will display the Range Filter form, configure as required and click OK. See section 2.10 Range Filter for an explanation.
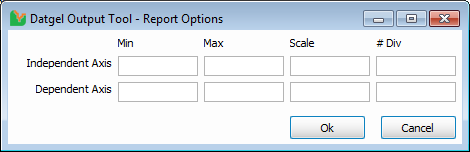
- Report Options: Clicking on the will display the Report Options form, configure as required and click OK. This is applicable to graphs only; other report types will have this field read-only.
- GDW Page No.: Setting the same value for two or more rows in the reports grid will initiate those rows to export to the same named GDW page, and then print/preview/export as configured. For example, if you have a direct shear graph report sheet that requires the presentation of 3 graph frames on one sheet then set the three graph report's GDW Page No. to Direct Shear Comp. If you have a different multi frame sheet in the same reports grid, then use GDW Page No. Direct Shear Comp A etc.
- Counter Increment: Defines the increment for Auto Counter System Place Holders. Normally you would leave this column blank and use the default "1", but when you have a report that will output multiple pages you would enter the number of pages here, e.g. "3". Seeing the Output Tool doesn't know how many pages the report will print, you need to manually type in the value.
- Add Spec: Define additional gINT script specification section lines. This text will be added below the last line of the Datgel Output Tool generated text.
Report grid rows can be reordered by using the arrow controls ![]() /
/ ![]() /
/ ![]() /
/ ![]() and individual reports can be removed from the grid by selecting the applicable row in the Reports tab grid and by pressing the delete key on your keyboard.
and individual reports can be removed from the grid by selecting the applicable row in the Reports tab grid and by pressing the delete key on your keyboard.
Prior to reordering, inserting a row or copy-pasting you will be prompted to either Save the Current View, or to Cancel and return to the Report grid.
Right click in the grid to Insert a Row or Delete the selected rows.
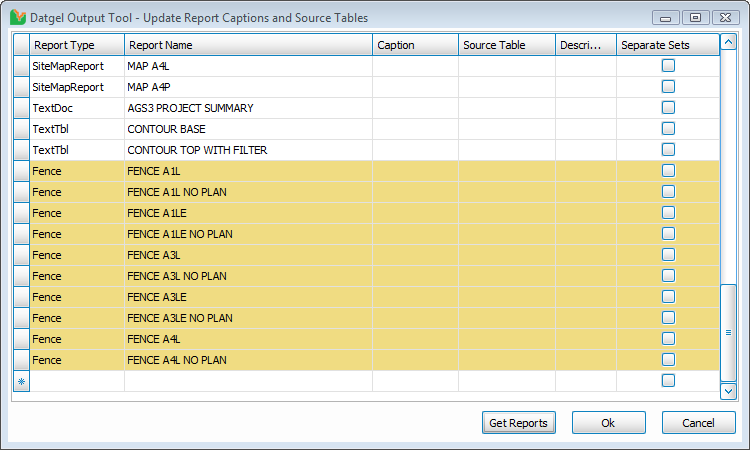
It is recommended Reports, Source Table, and Caption be defined by Output Tool > Reports > Update Reports Captions and Source Table command (see section 2.14 Update Reports Captions and Source Table). The Tool will function without this configuration.