One-Dimensional Consolidation
Supported Test Methods
Standard | Description |
|---|---|
| ASTM D2435/D2435M-11 | One-Dimensional Consolidation Properties of Soils Using Incremental Loading |
| ASTM D2435-04 | One-Dimensional Consolidation Properties of Soils |
| BS 1377-5:1990:3 | Determination of the one-dimensional consolidation properties |
| ISO/TS 17892-5:2004 | Incremental loading oedometer test |
Input
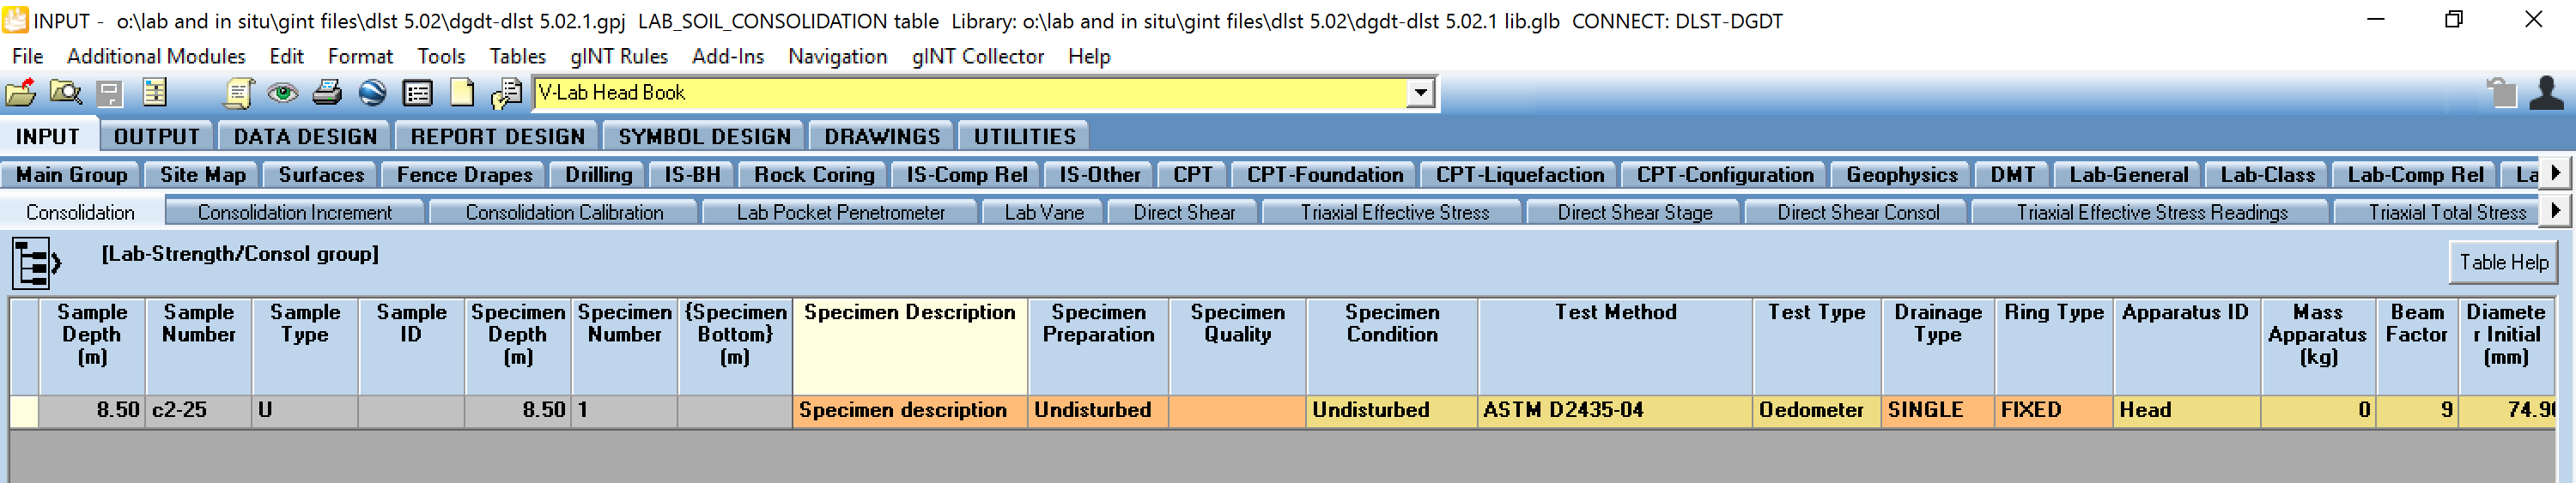
Lab-Strength/Consol | Consolidation
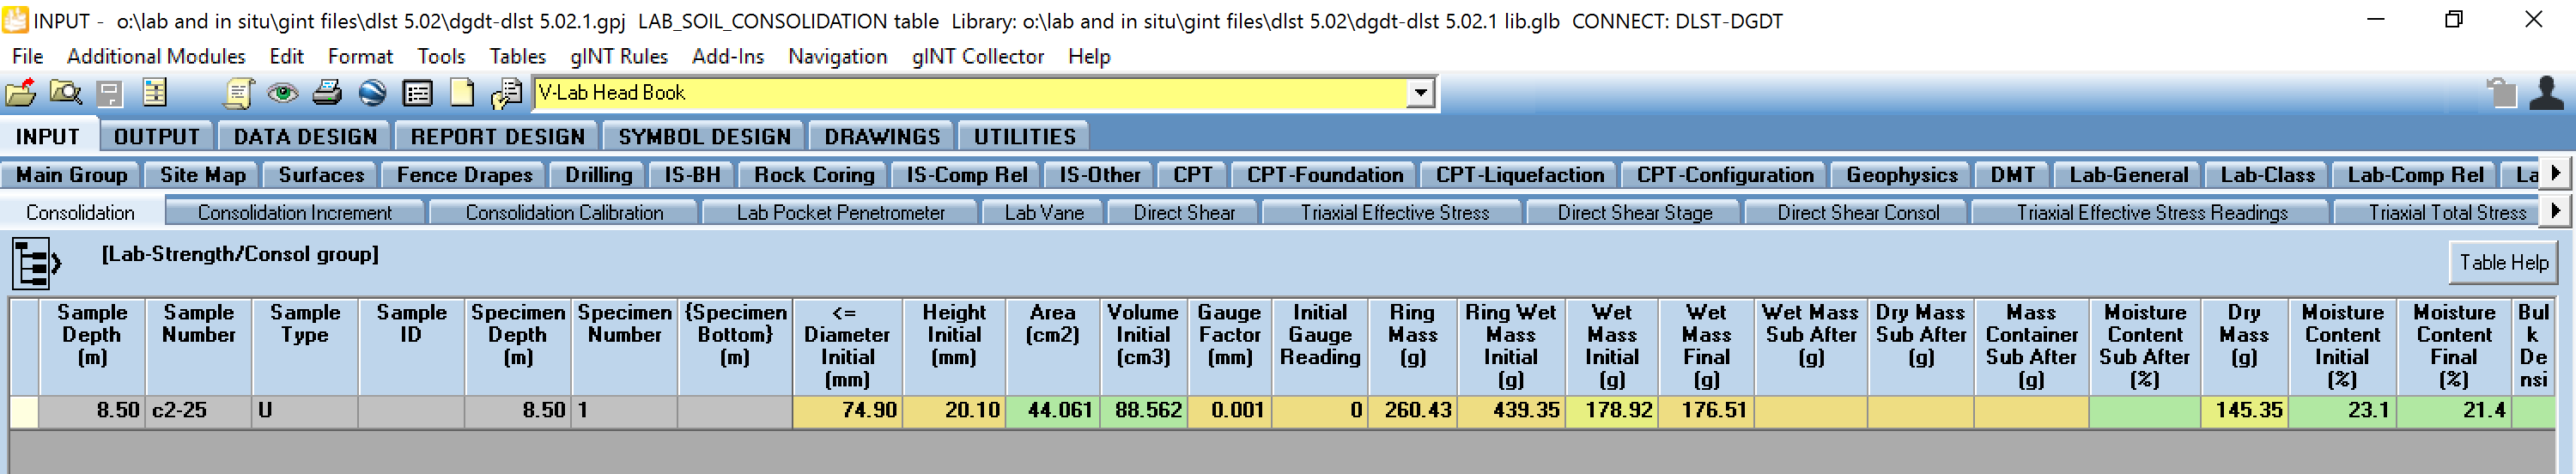
To calculate the consolidation of a specimen, first you must enter the relevant data in the Consolidation table.
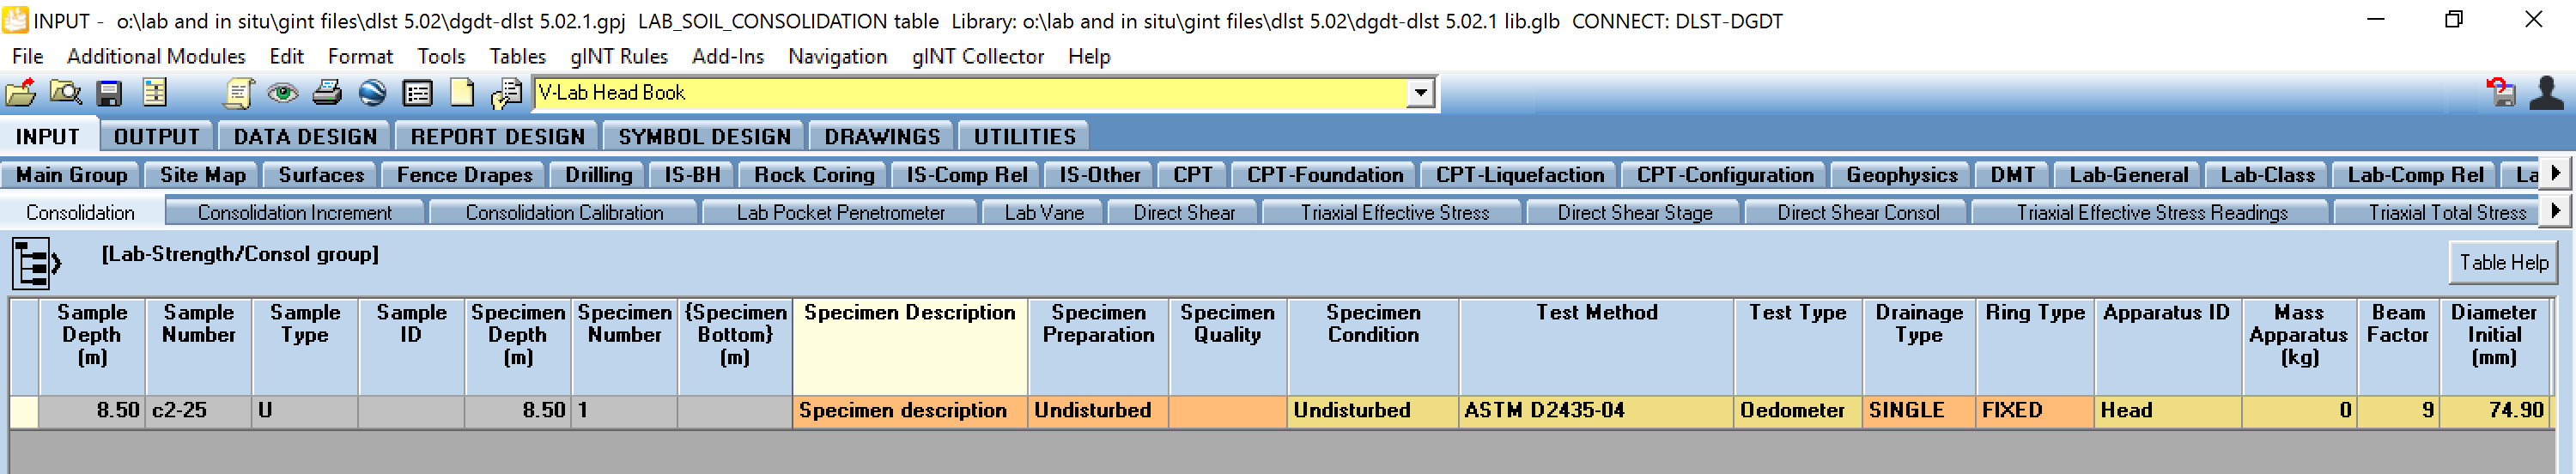
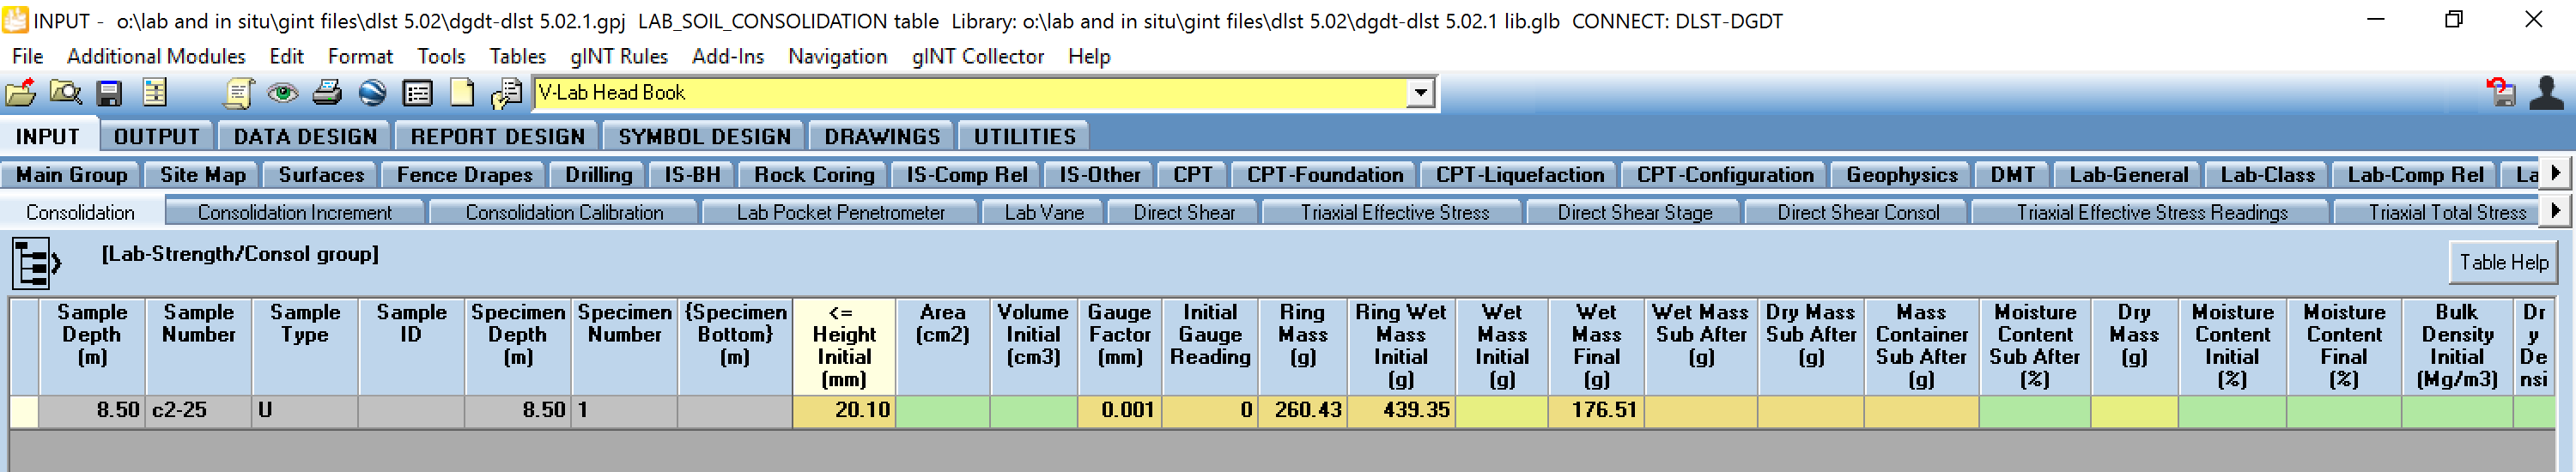
Once the data is entered, click Save or Ctrl+S and green cells will be calculated.
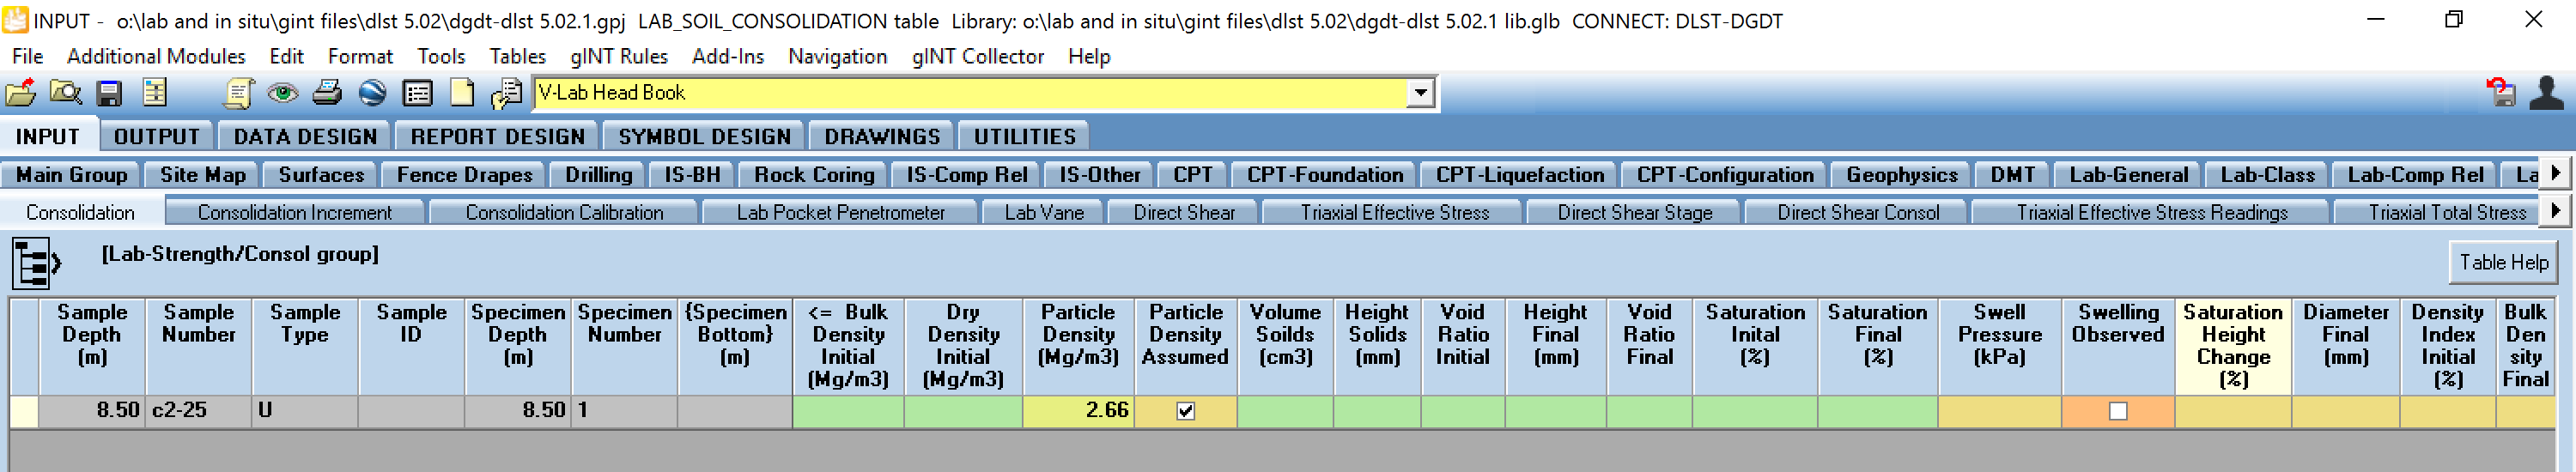
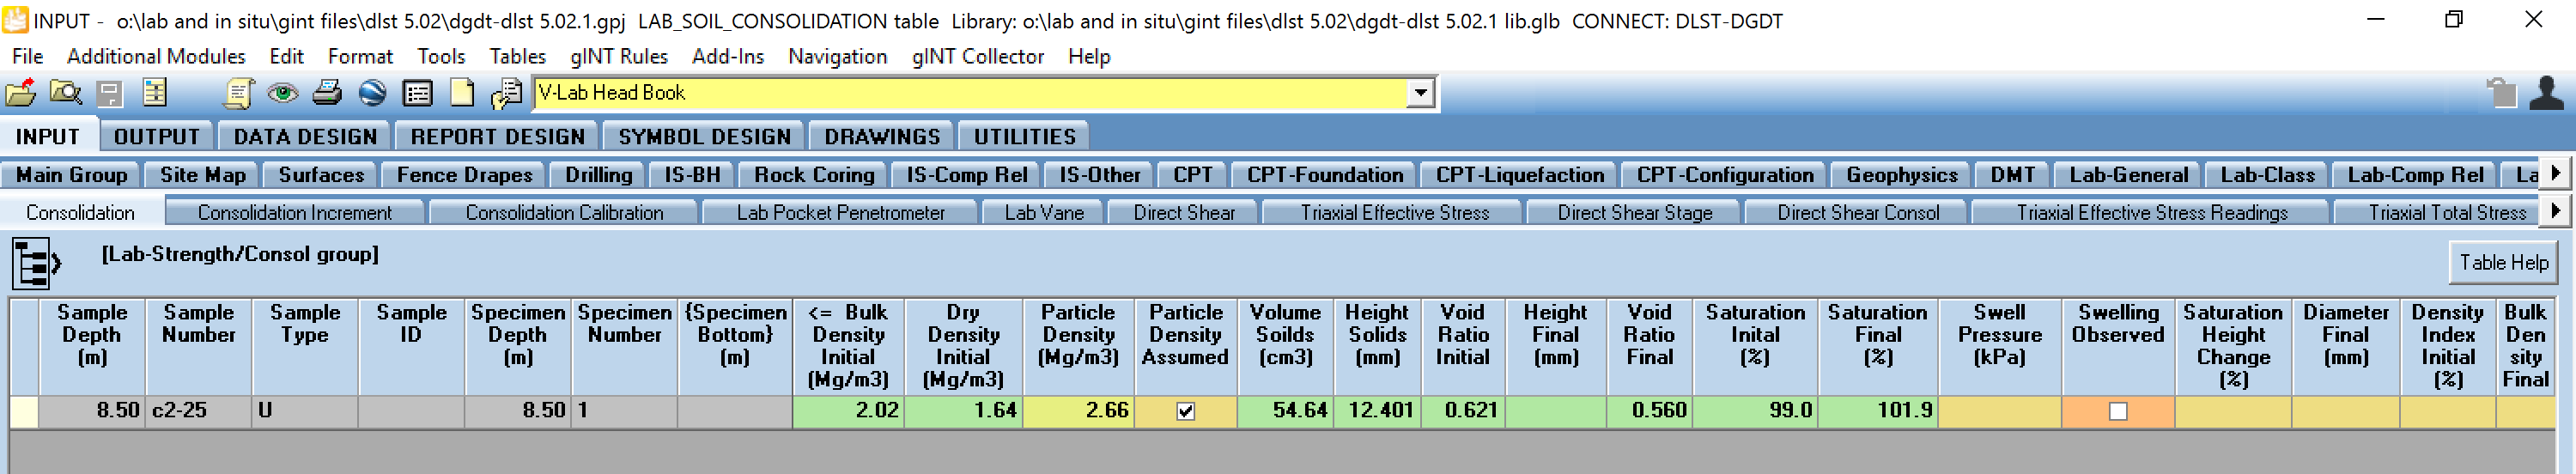
Particle Density / Specific Gravity
If the particle density value is assumed, check the box in Particle_Density_Assumed field and enter the value in the Particle_Density field.
Otherwise, the field Particle_Density or Specific_Gravity will be populated according to the following criteria and in that order by design:
- Value stored in Particle_Density table for that Specimen. If there are more than one value, takes the average of them,
- Value stored in Point_Options.Default_Particle_Density,
- Value stored in Project_Options.Default_Particle_Density,
- Otherwise, the code assumes a value of 2.65.
If you are using English unit gINT Files, you should use Specific Gravity value (unitless).
Then you can move to the Consolidation_Increment and Consolidation_Readings.
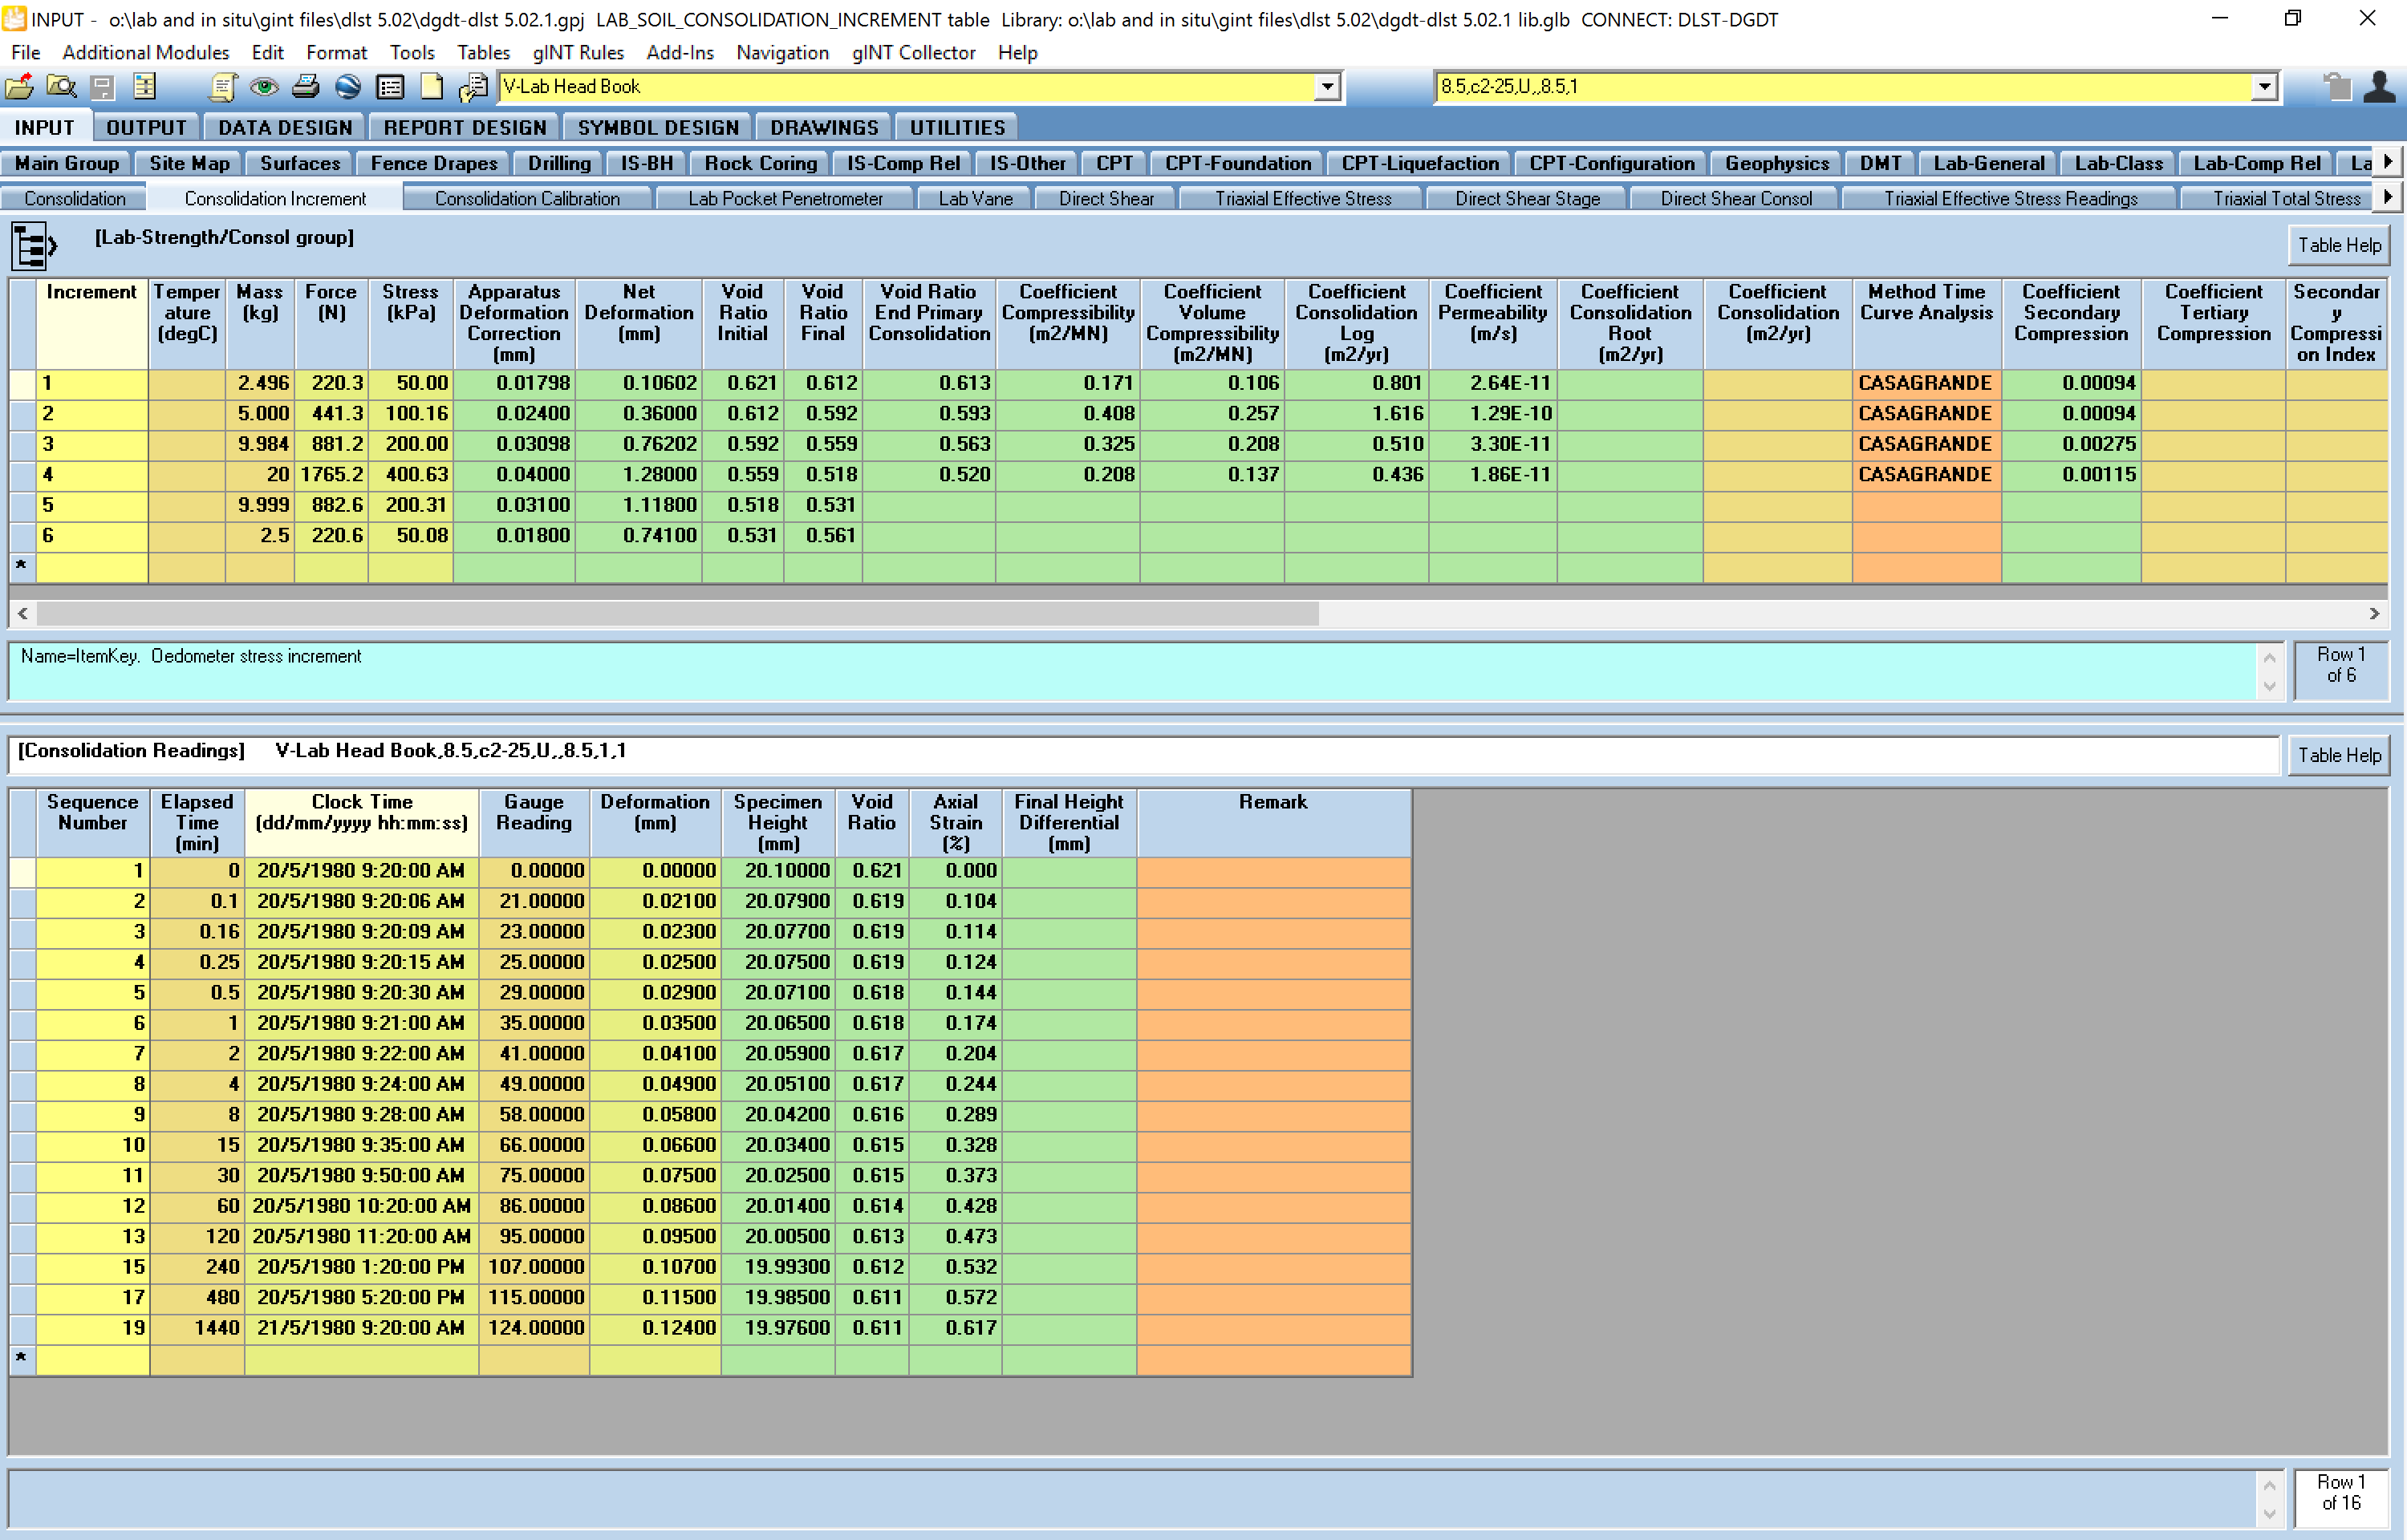
Lab-Strength/Consol | Consolidation Increment
The Consolidation_Increment table (upper) stores the data of each increment. Enter the data for each increment (Increment Number and Stress or Mass). Relevant fields will be calculated at this point when you click Save, change row or Ctrl+S
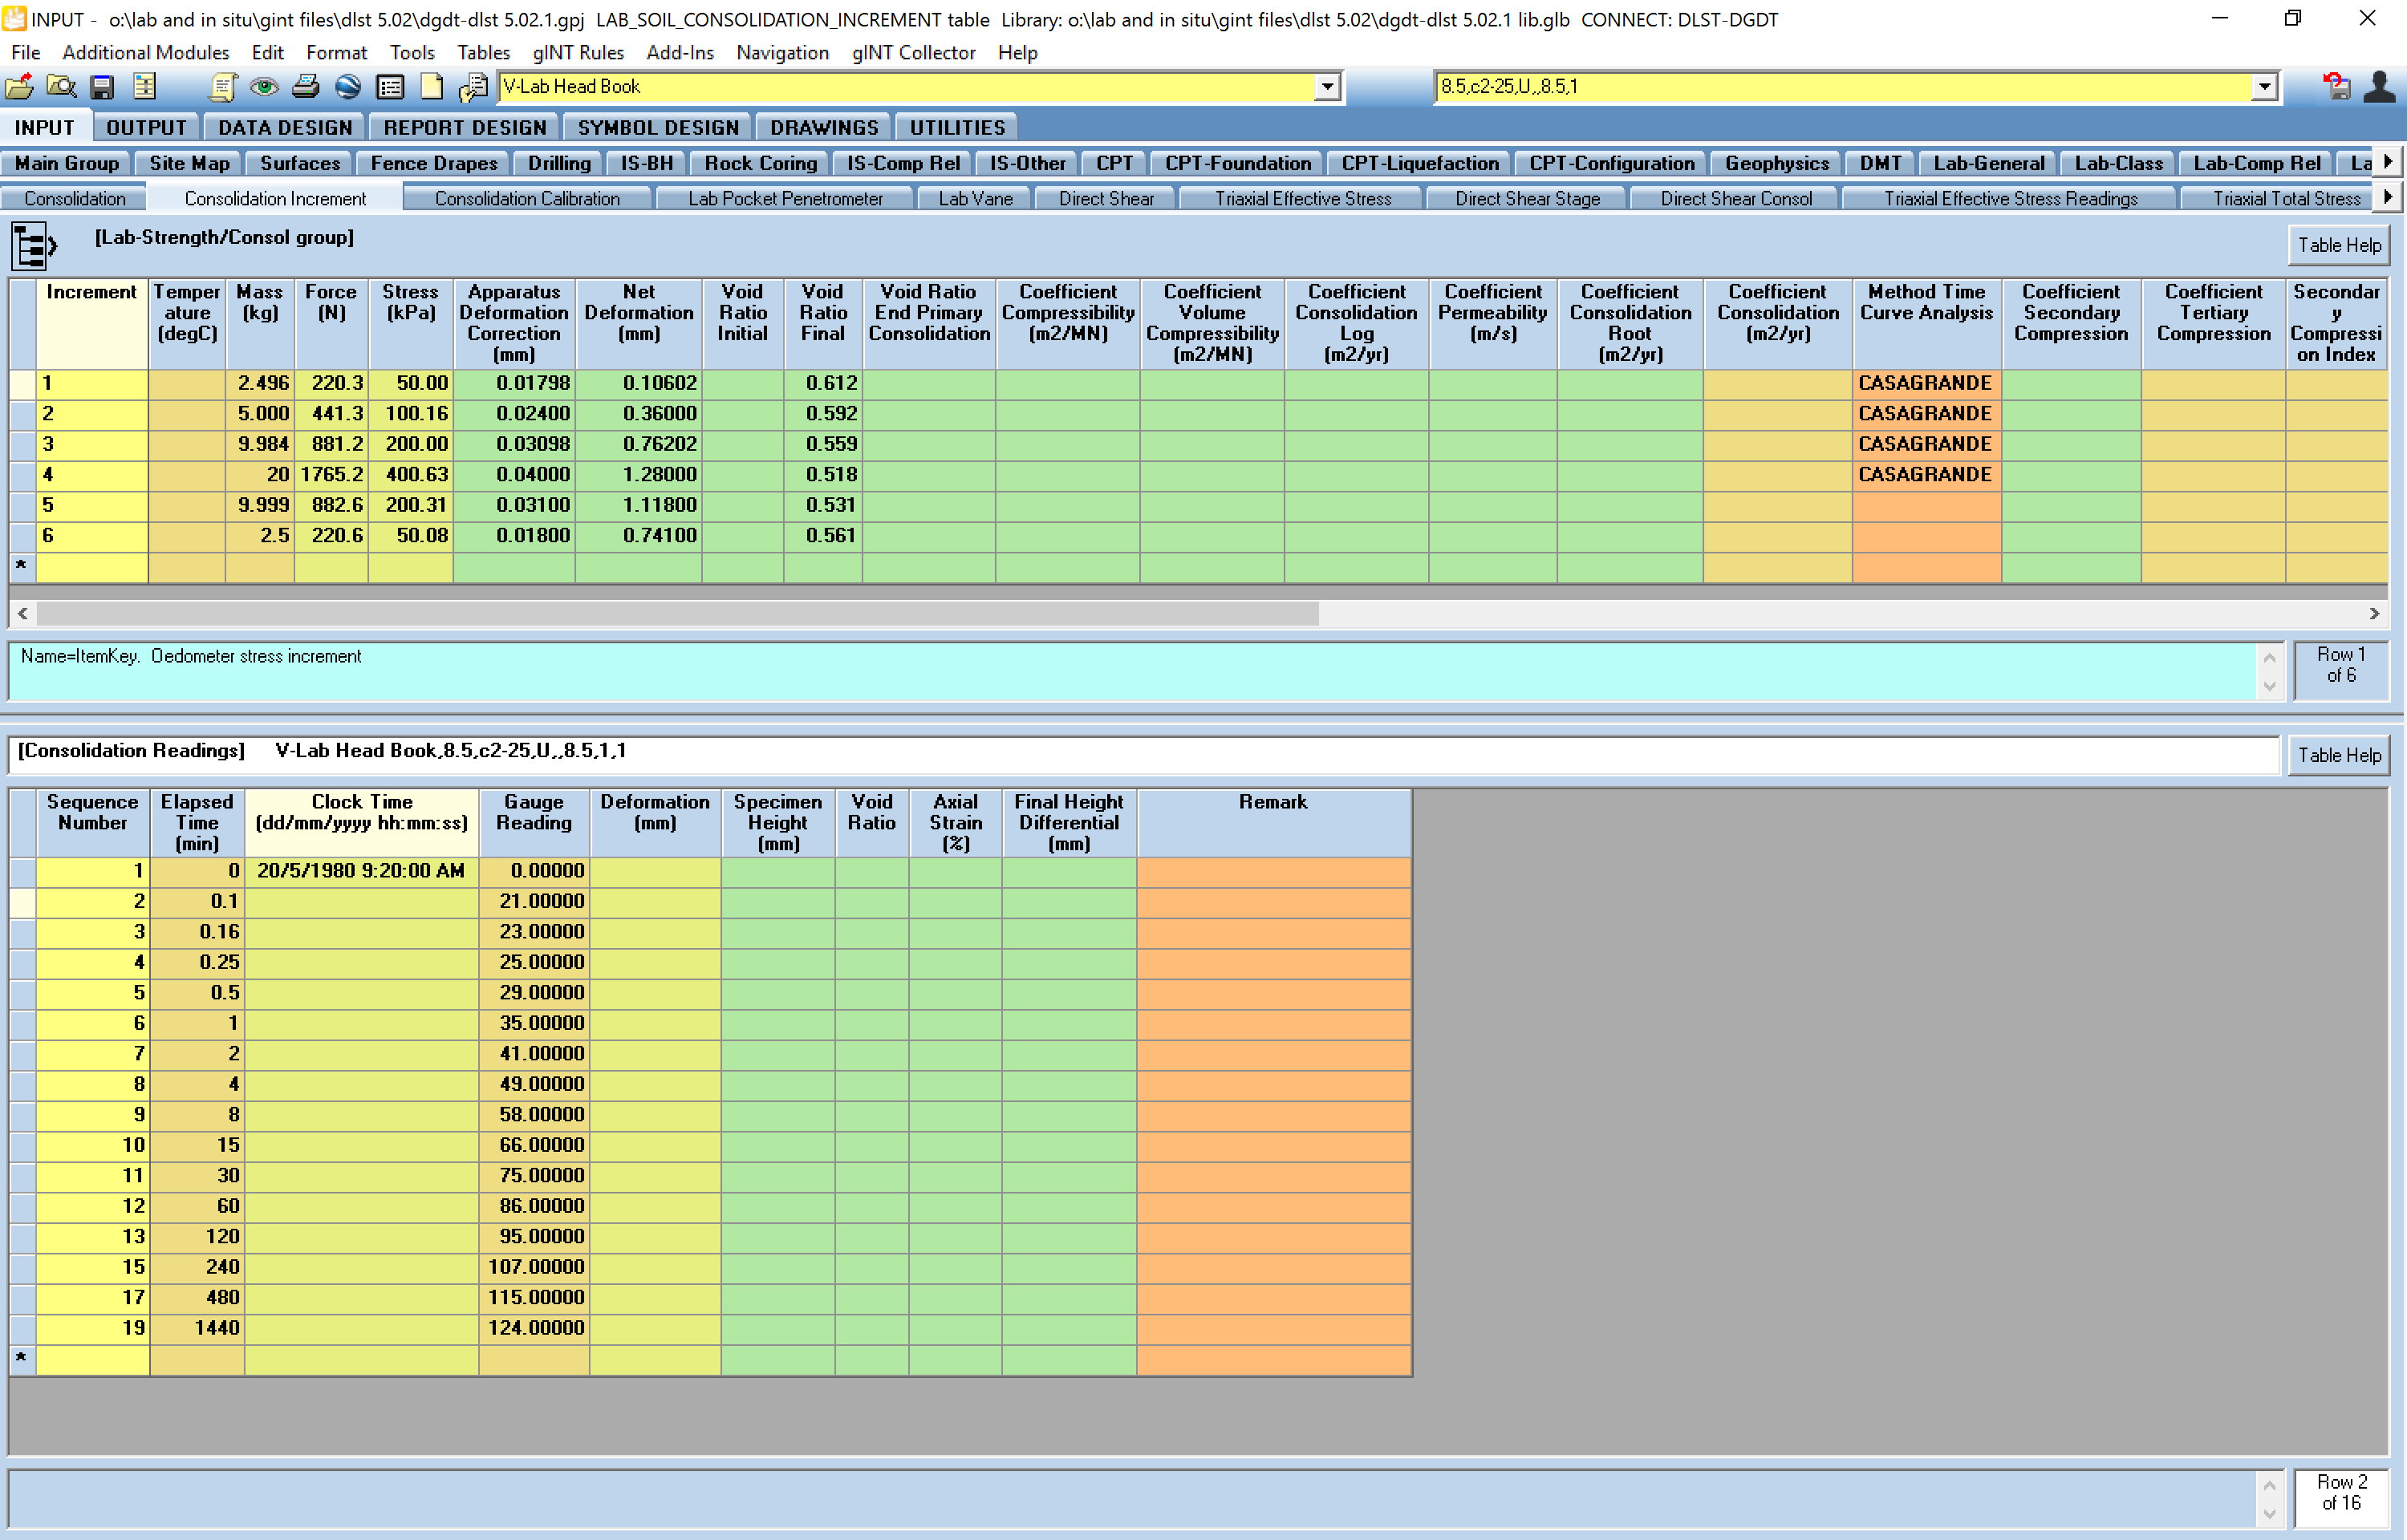
Lab-Strength/Consol | Consolidation Readings
For each increment, enter data in the Consolidation_Readings table (lower). The Sequence_Number field is automatically populated and adjusted to the data. Enter Elapsed_Time, enter the first Clock_Time in dd/mm/yyyy hh:mm:ss and click Save for calculating the entire column. Enter the Gauge_Reading and Deformation (optional) and click Save or Ctrl+S to initiate the calculations.
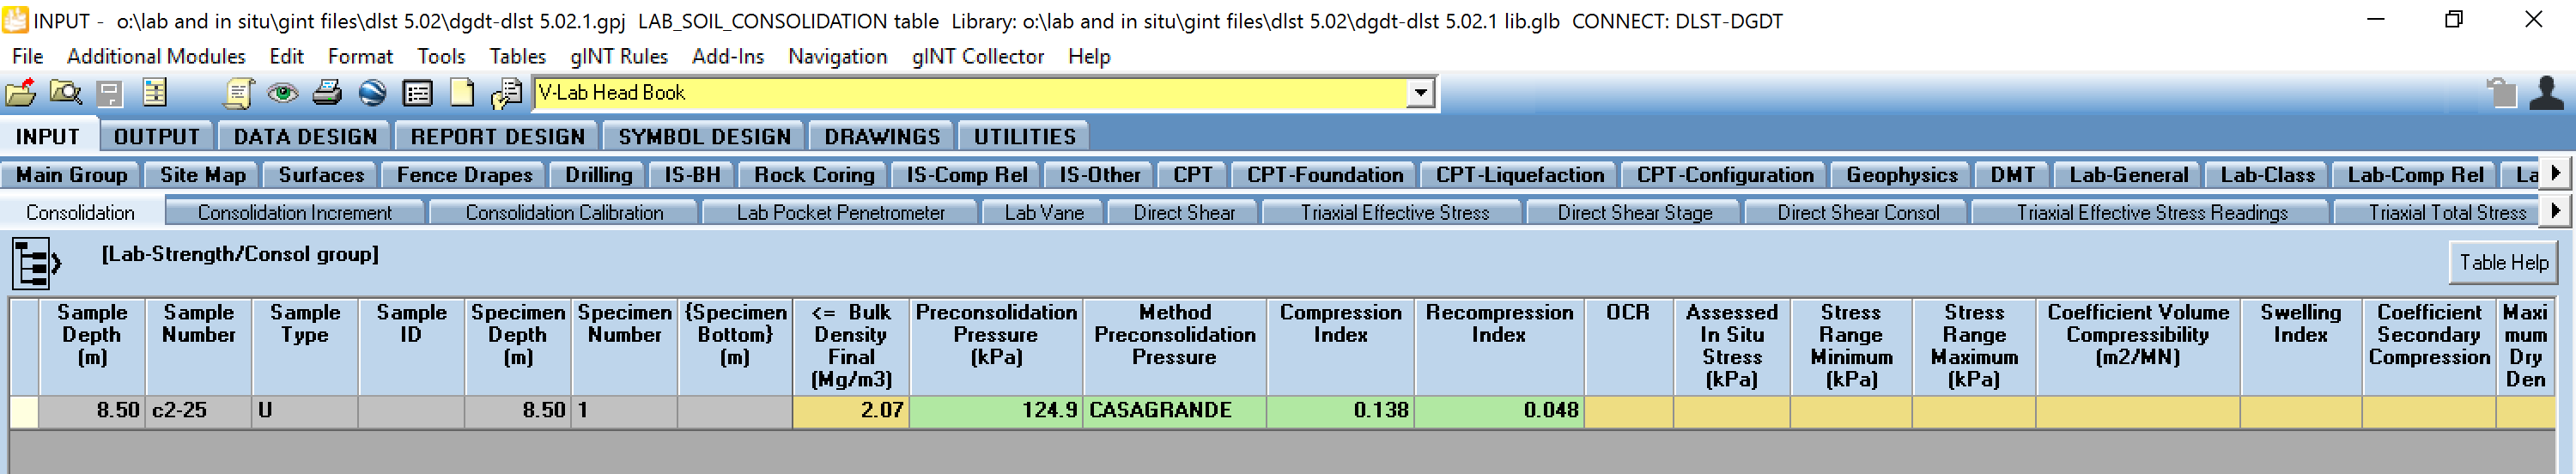
Consolidation Results
To determine consolidation results from the consolidation plot, select Add-Ins > Datgel Lab Tool > Consolidation Graph to launch the test curve plot based on the recorded test data. You must be on the Soil Consolidation related tables to run this command.
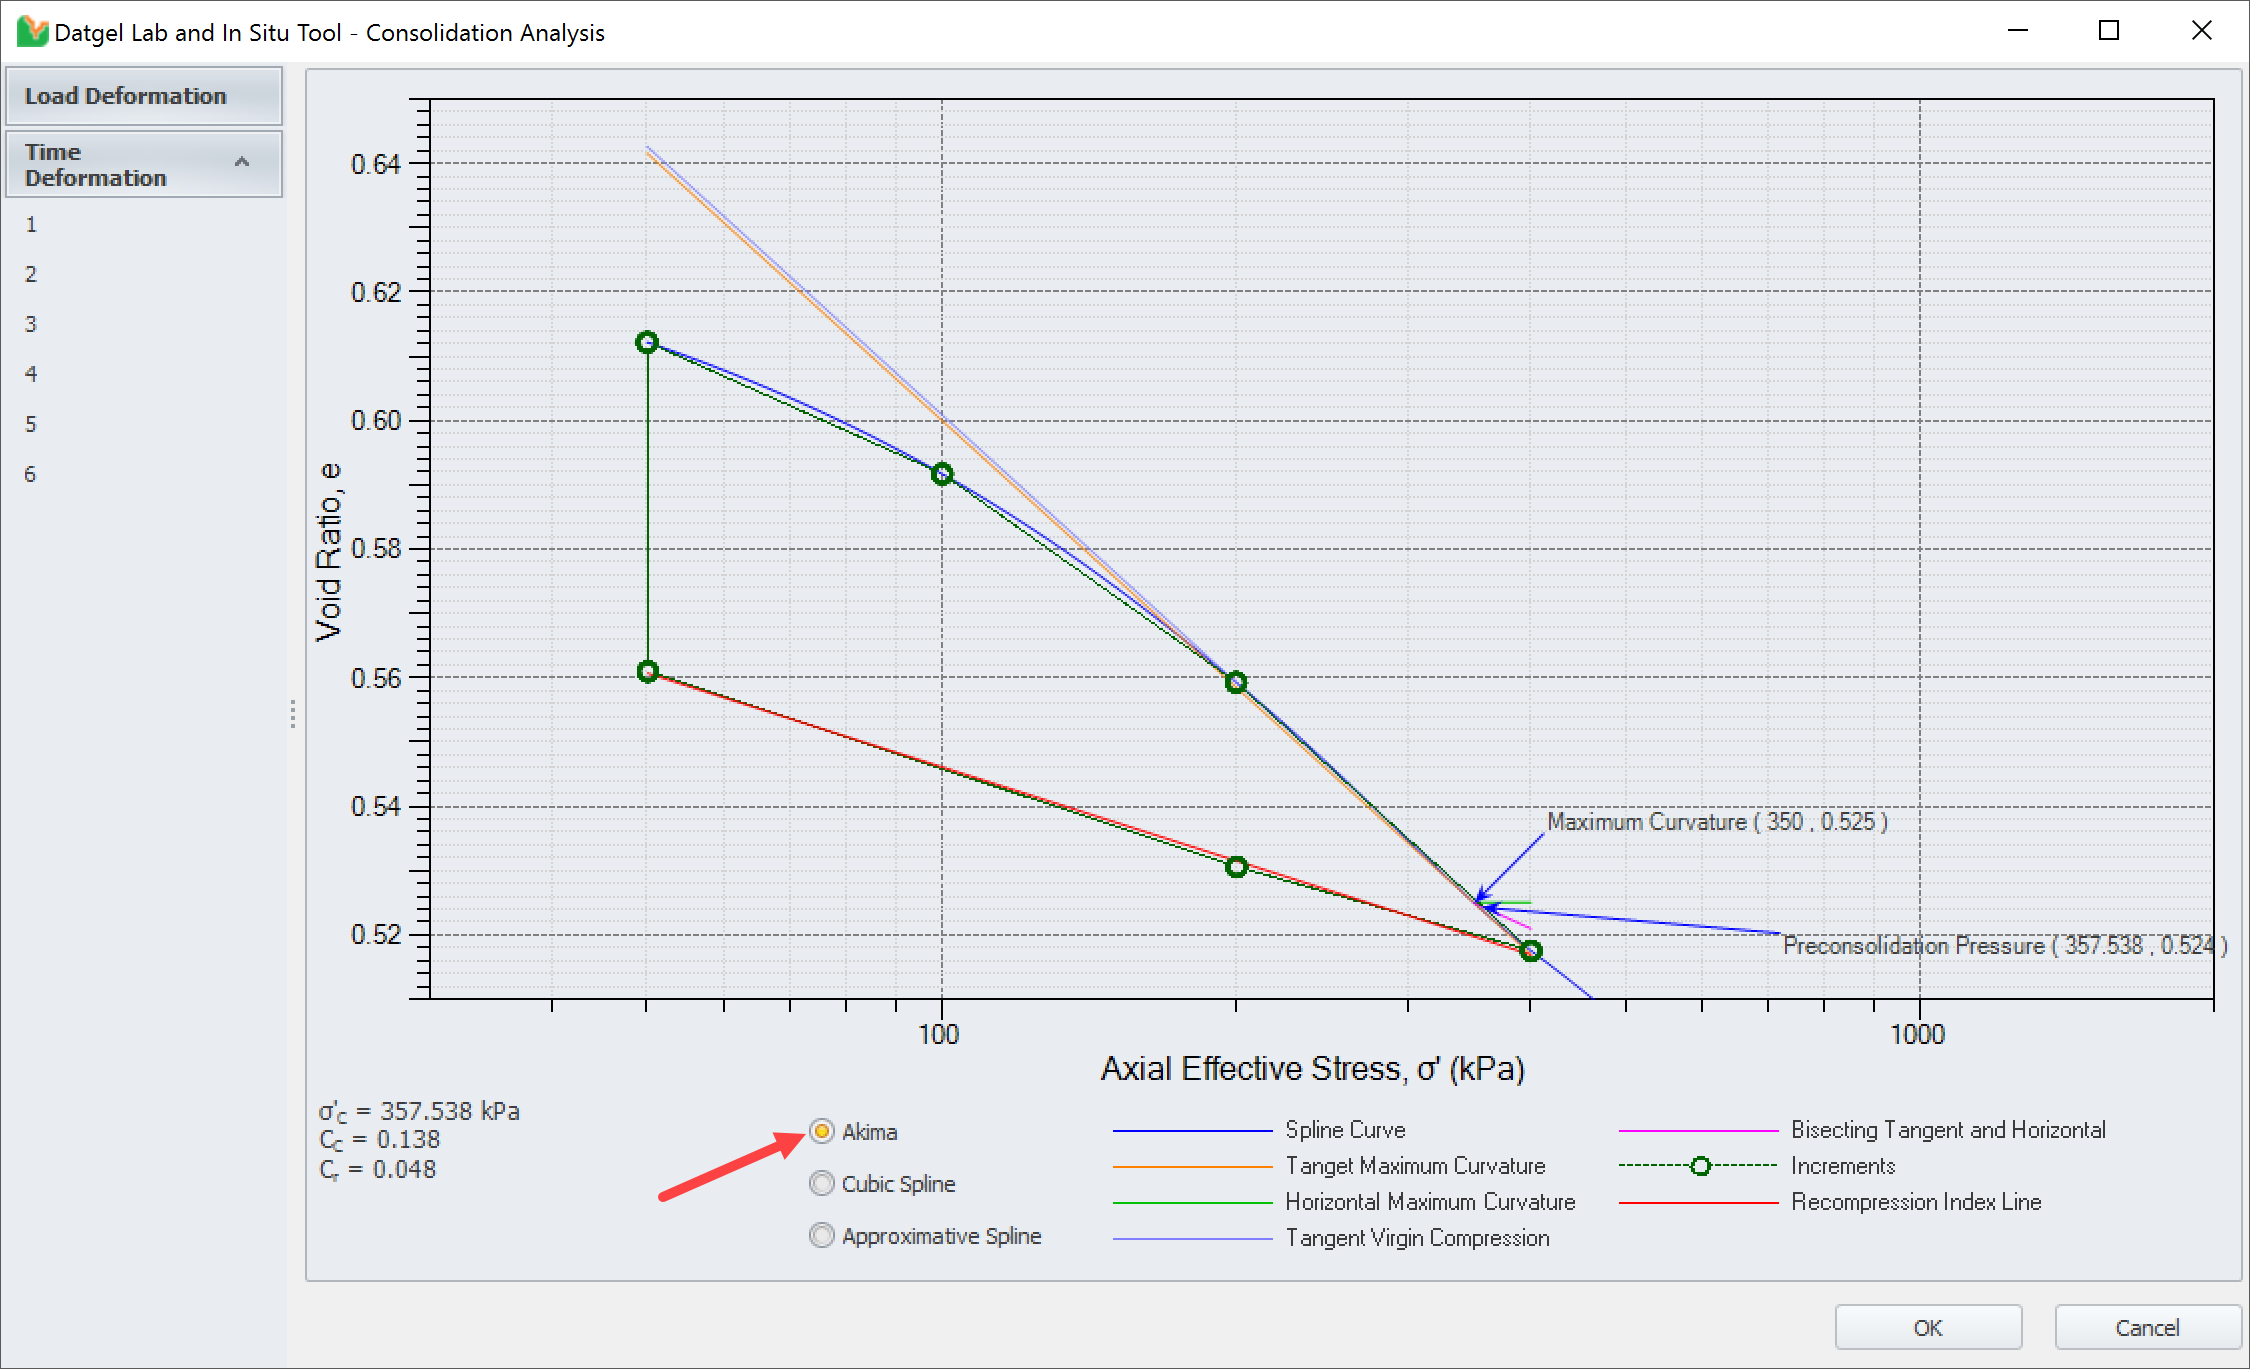
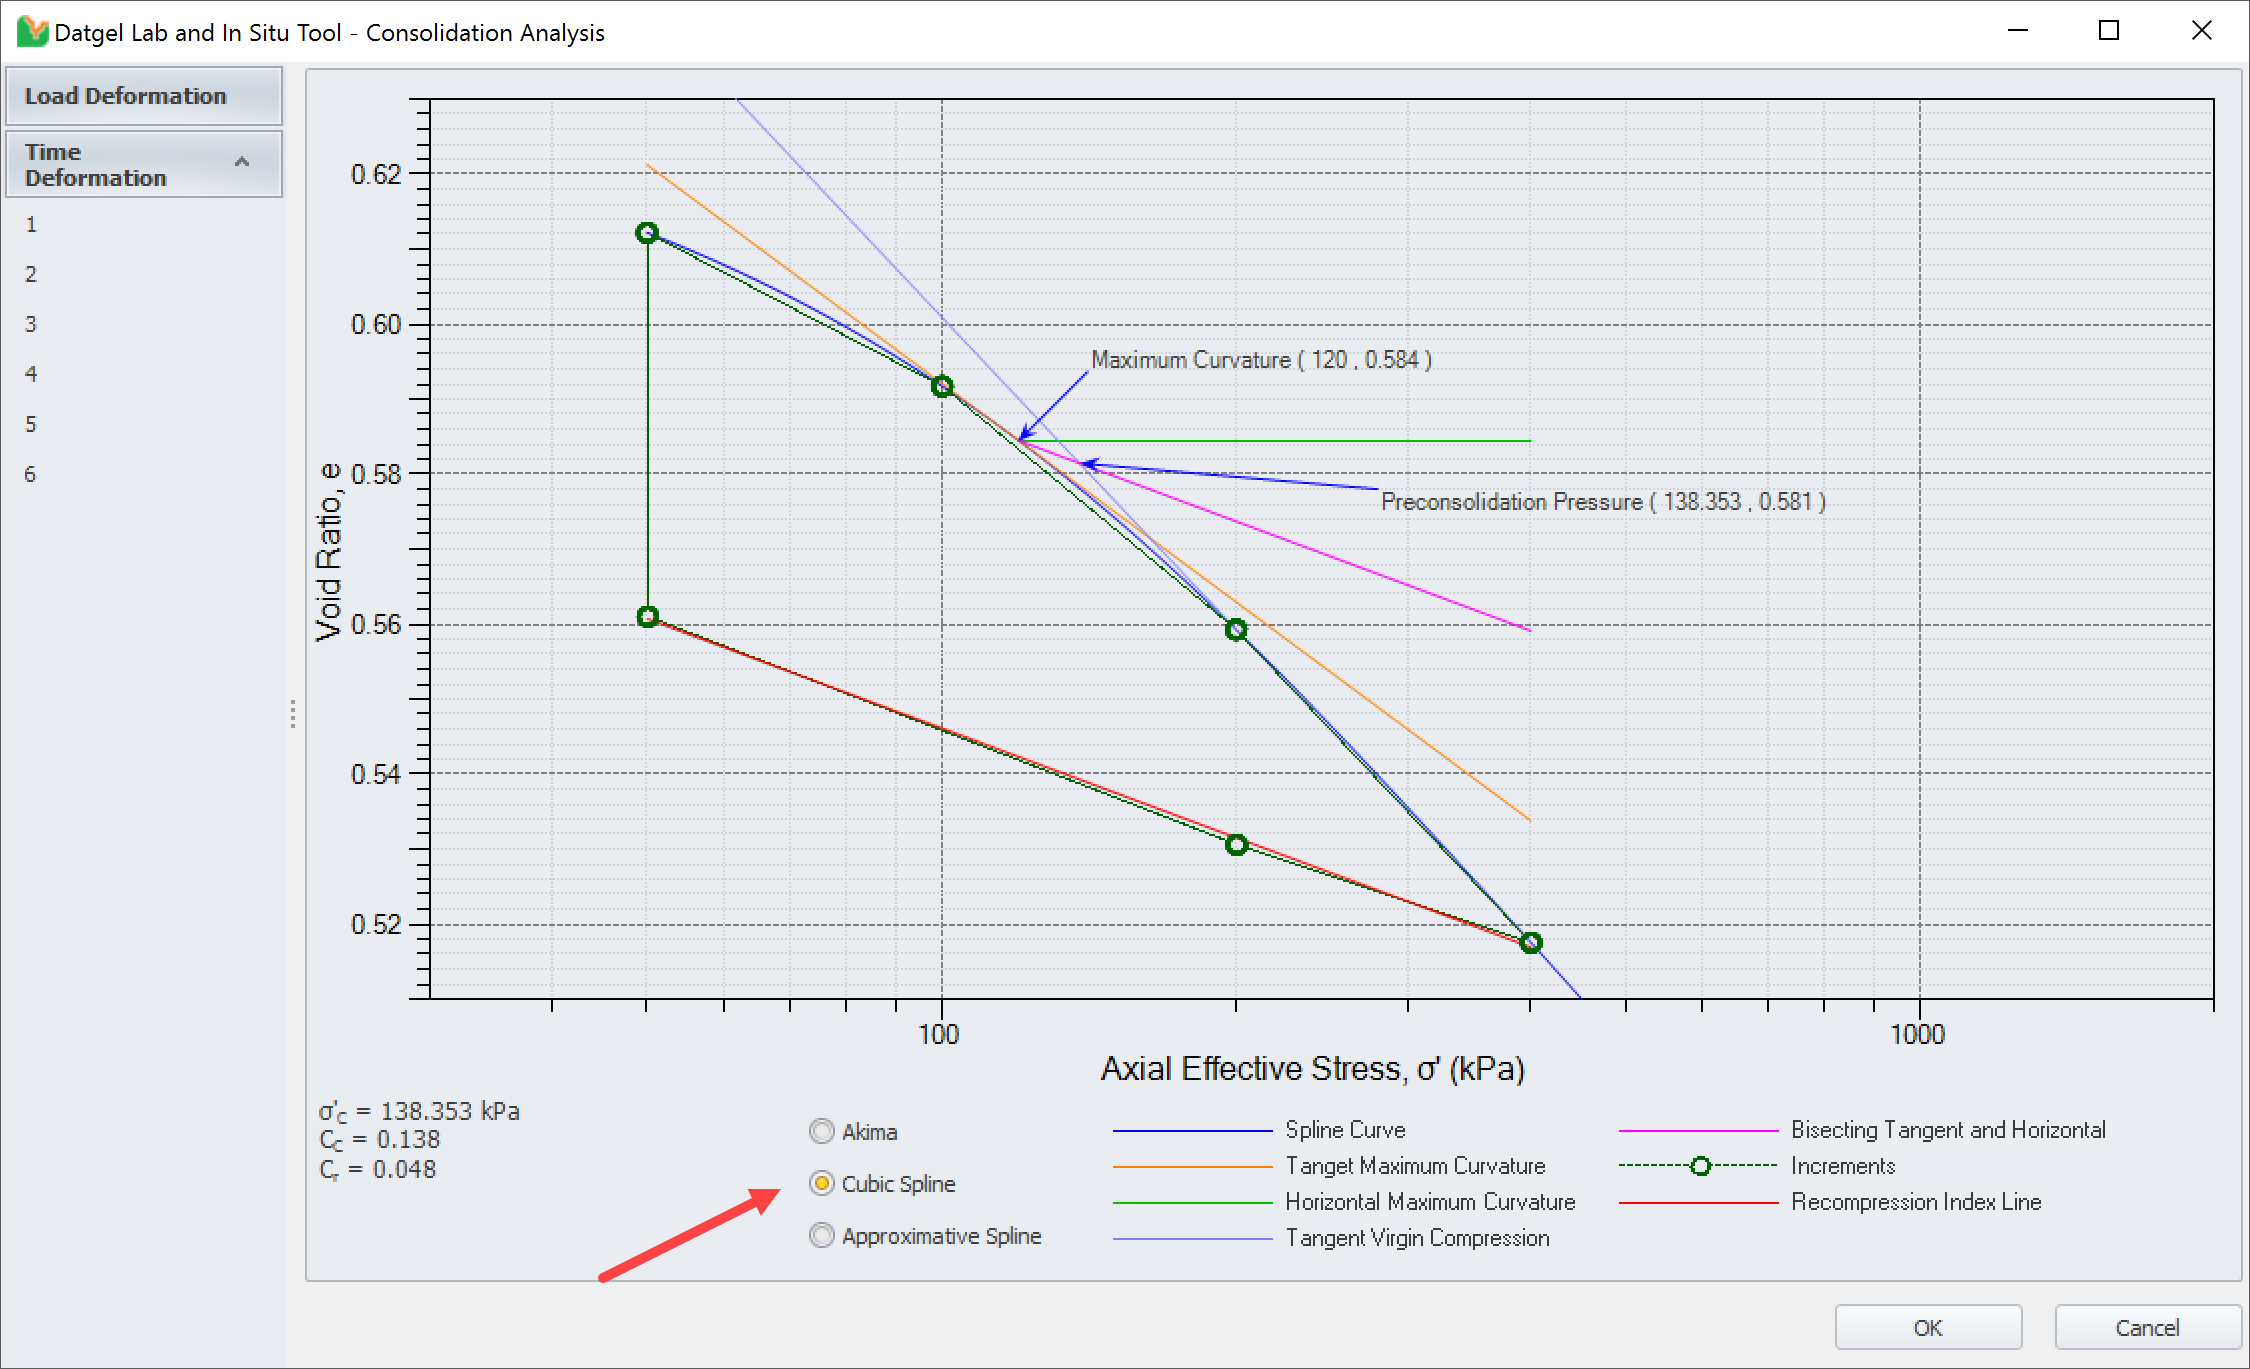
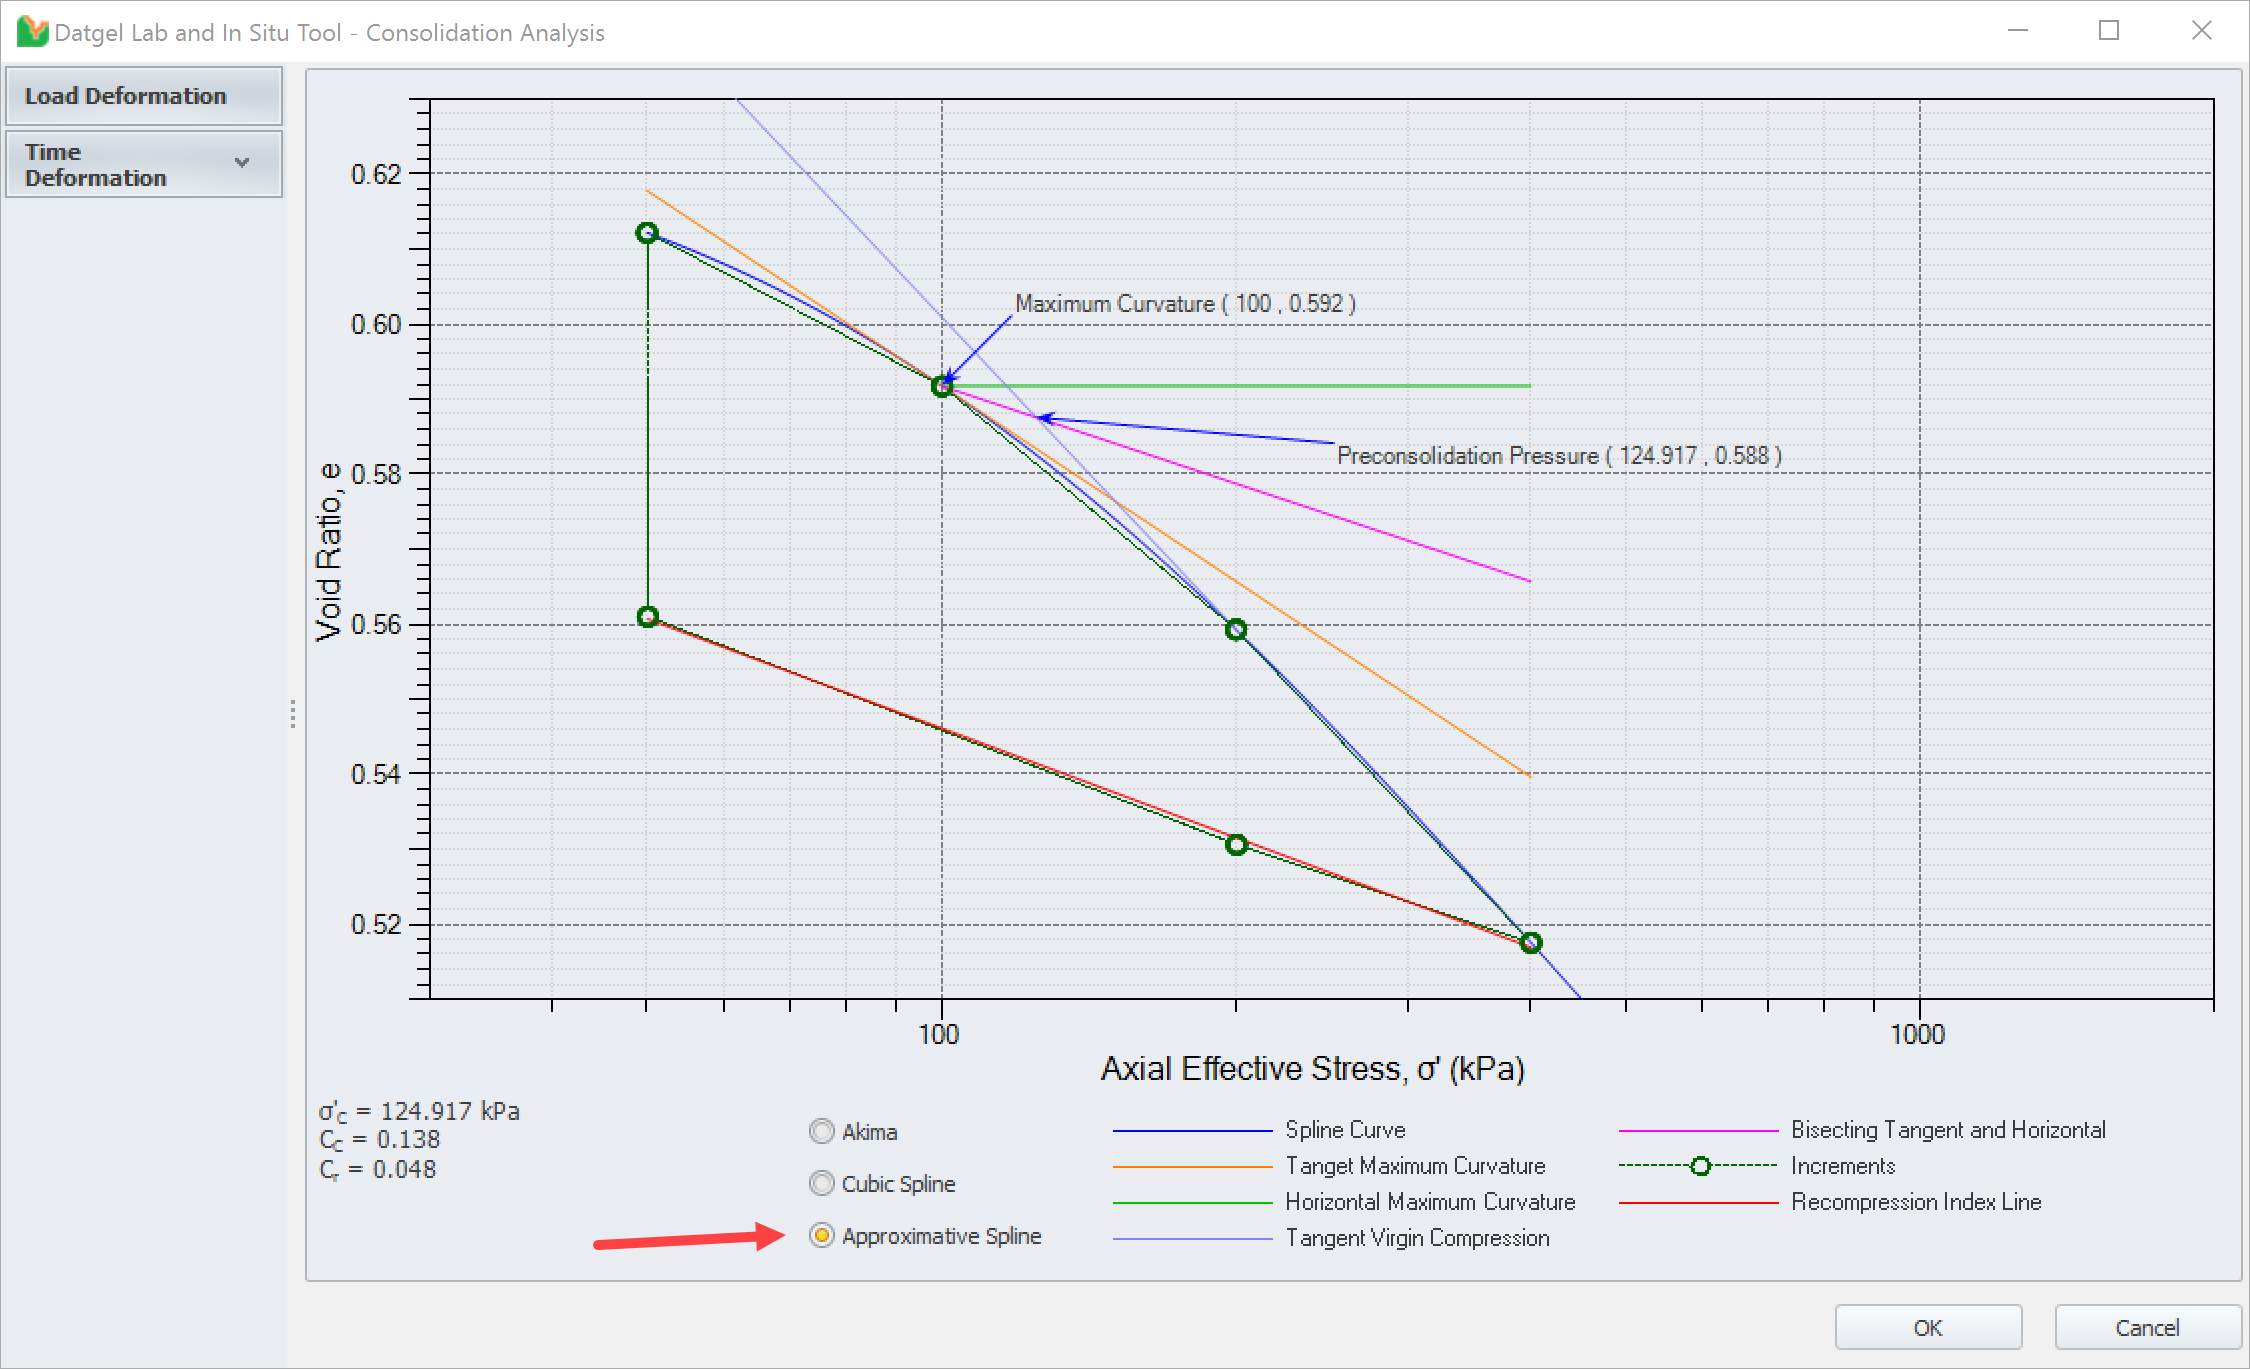
Load Deformation graph
Once the graph is launched, you can review the Load Deformation graphical data and set the calculation procedure (Akima, Cubic Spline or Approximative Spline) by clicking on the desired bullet in the lower frame of the graph as, shown in next set of figures.
Time Deformation increment graph
To launch the calculation for each increment, click on Time Deformation button. Deformation vs. Time graph of all increments is displayed.
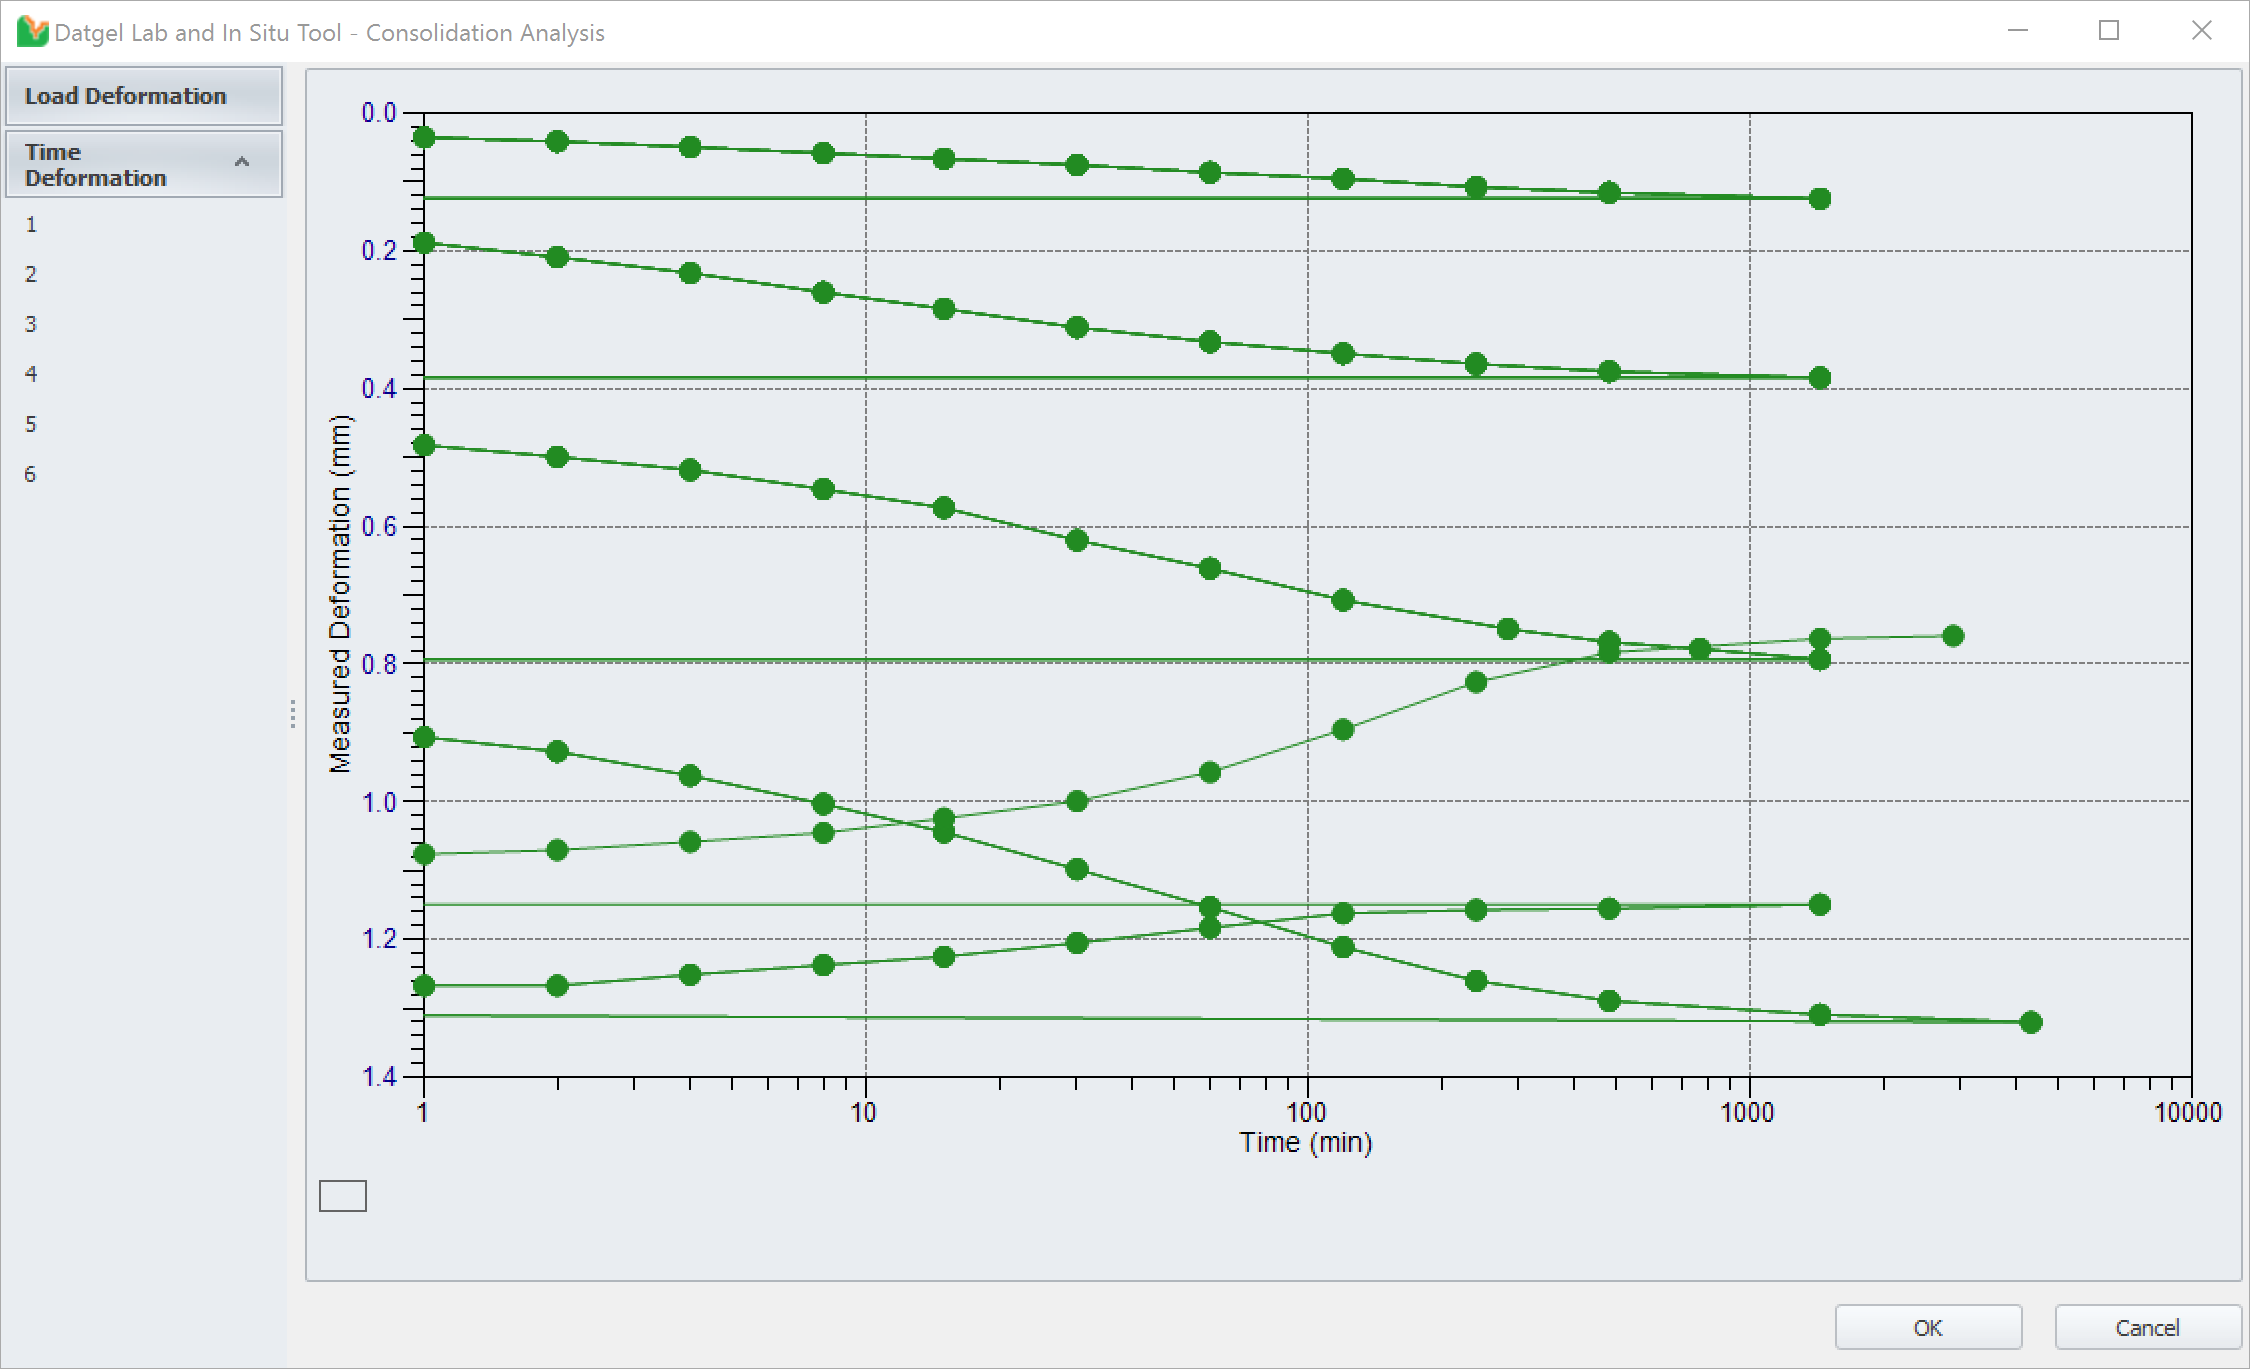
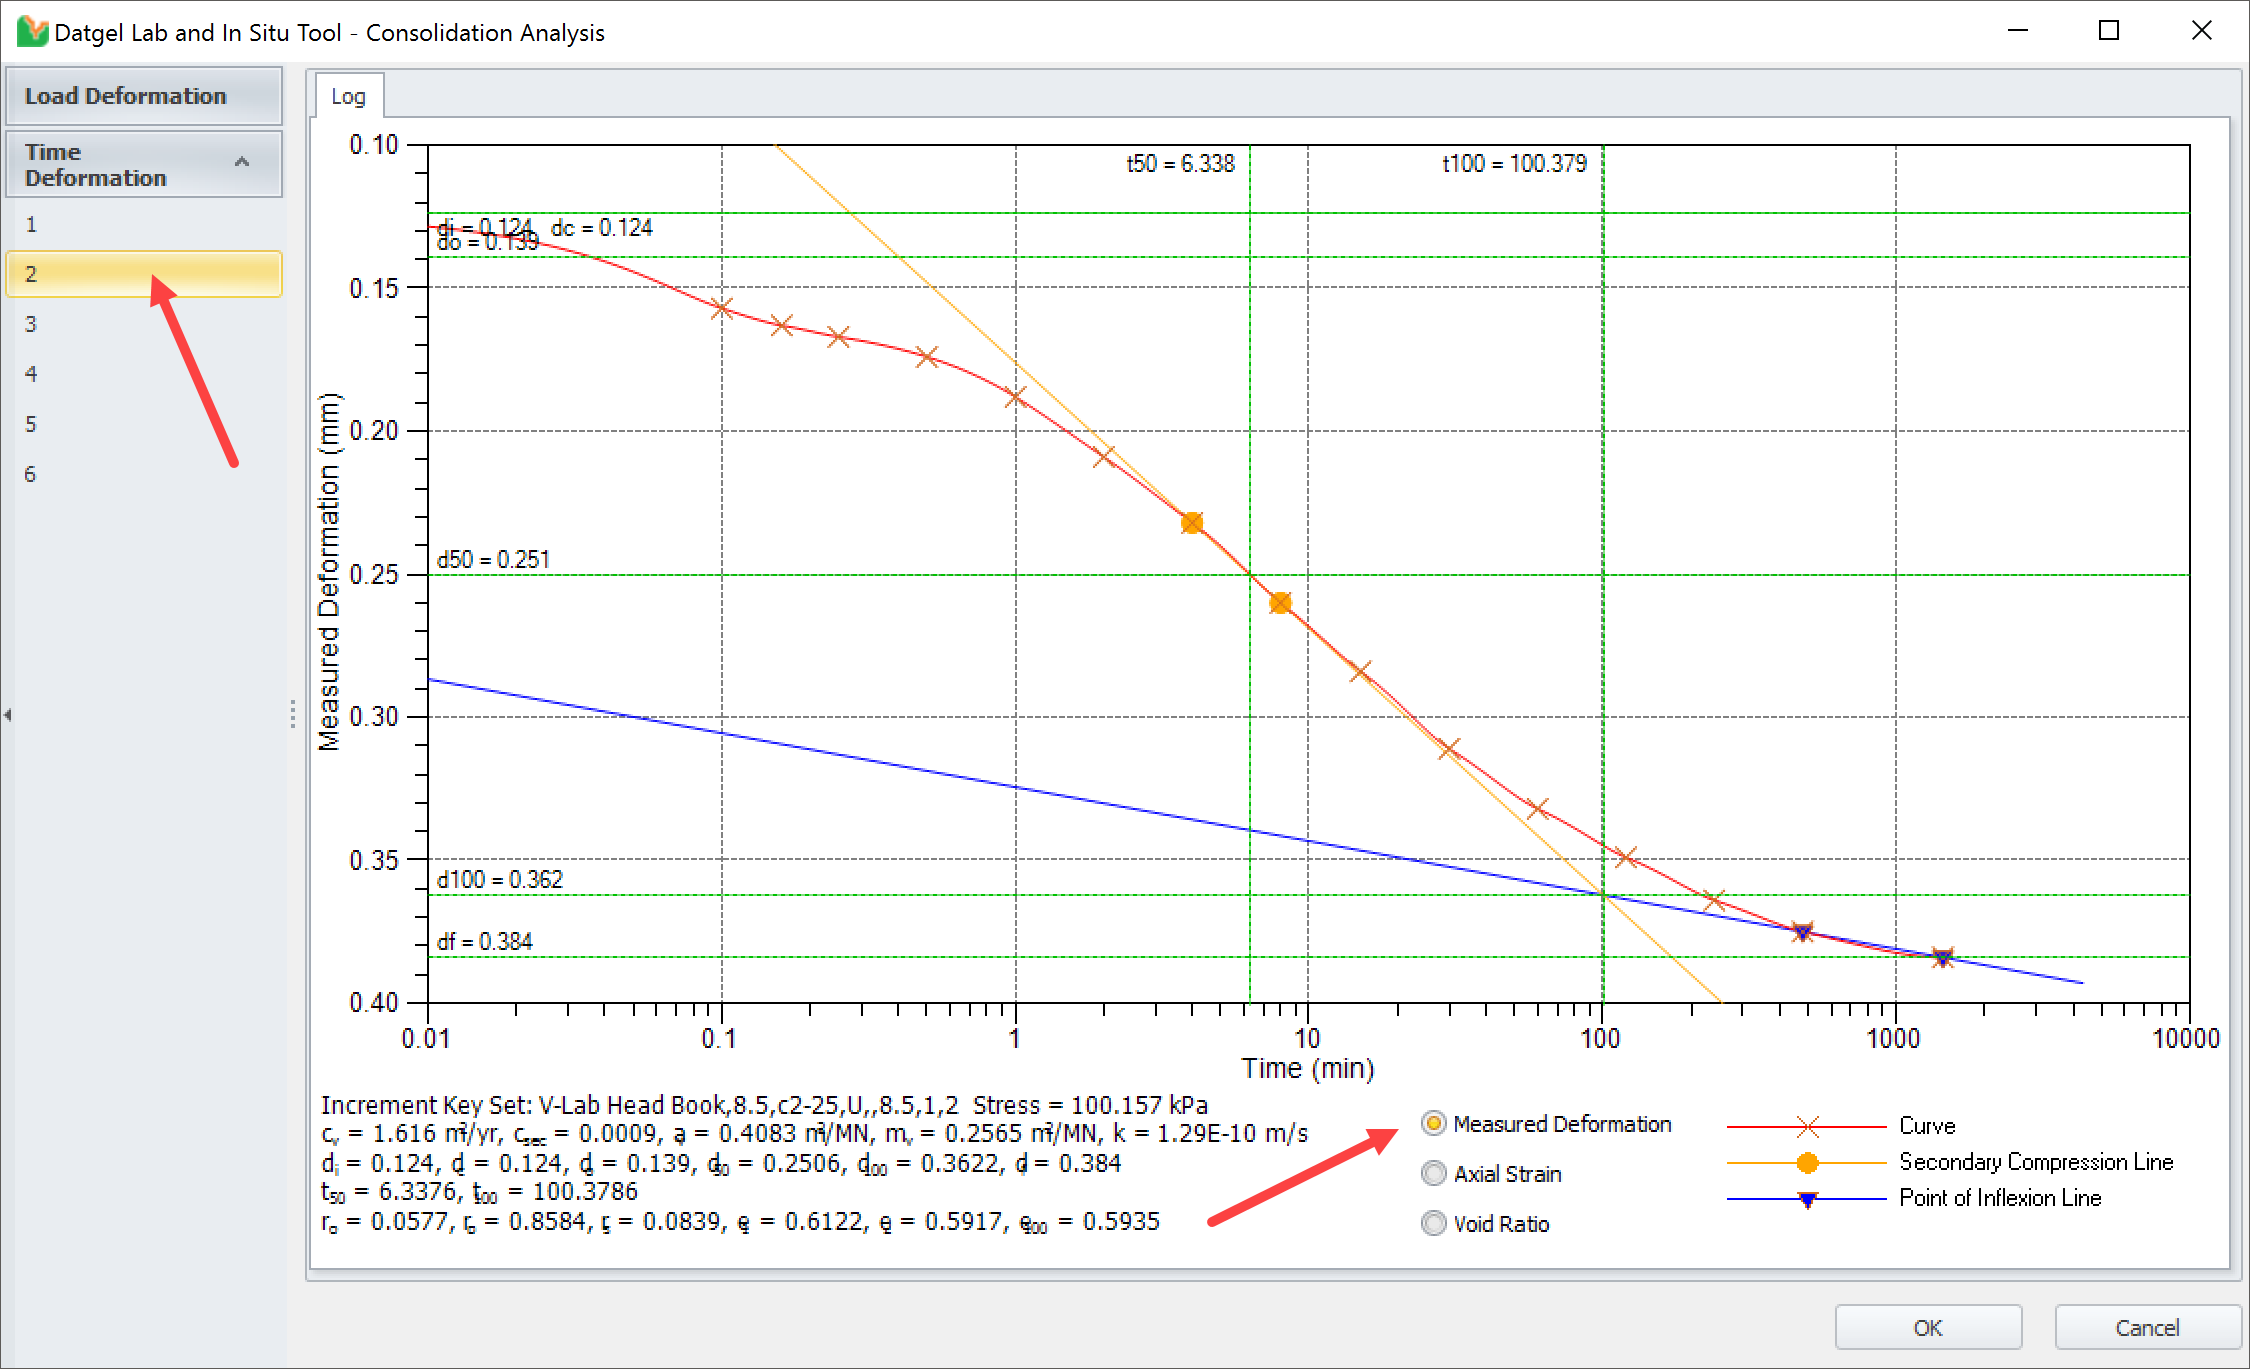
Each increment can be reviewed individually by clicking in the increment number from the list in the left side of the form.
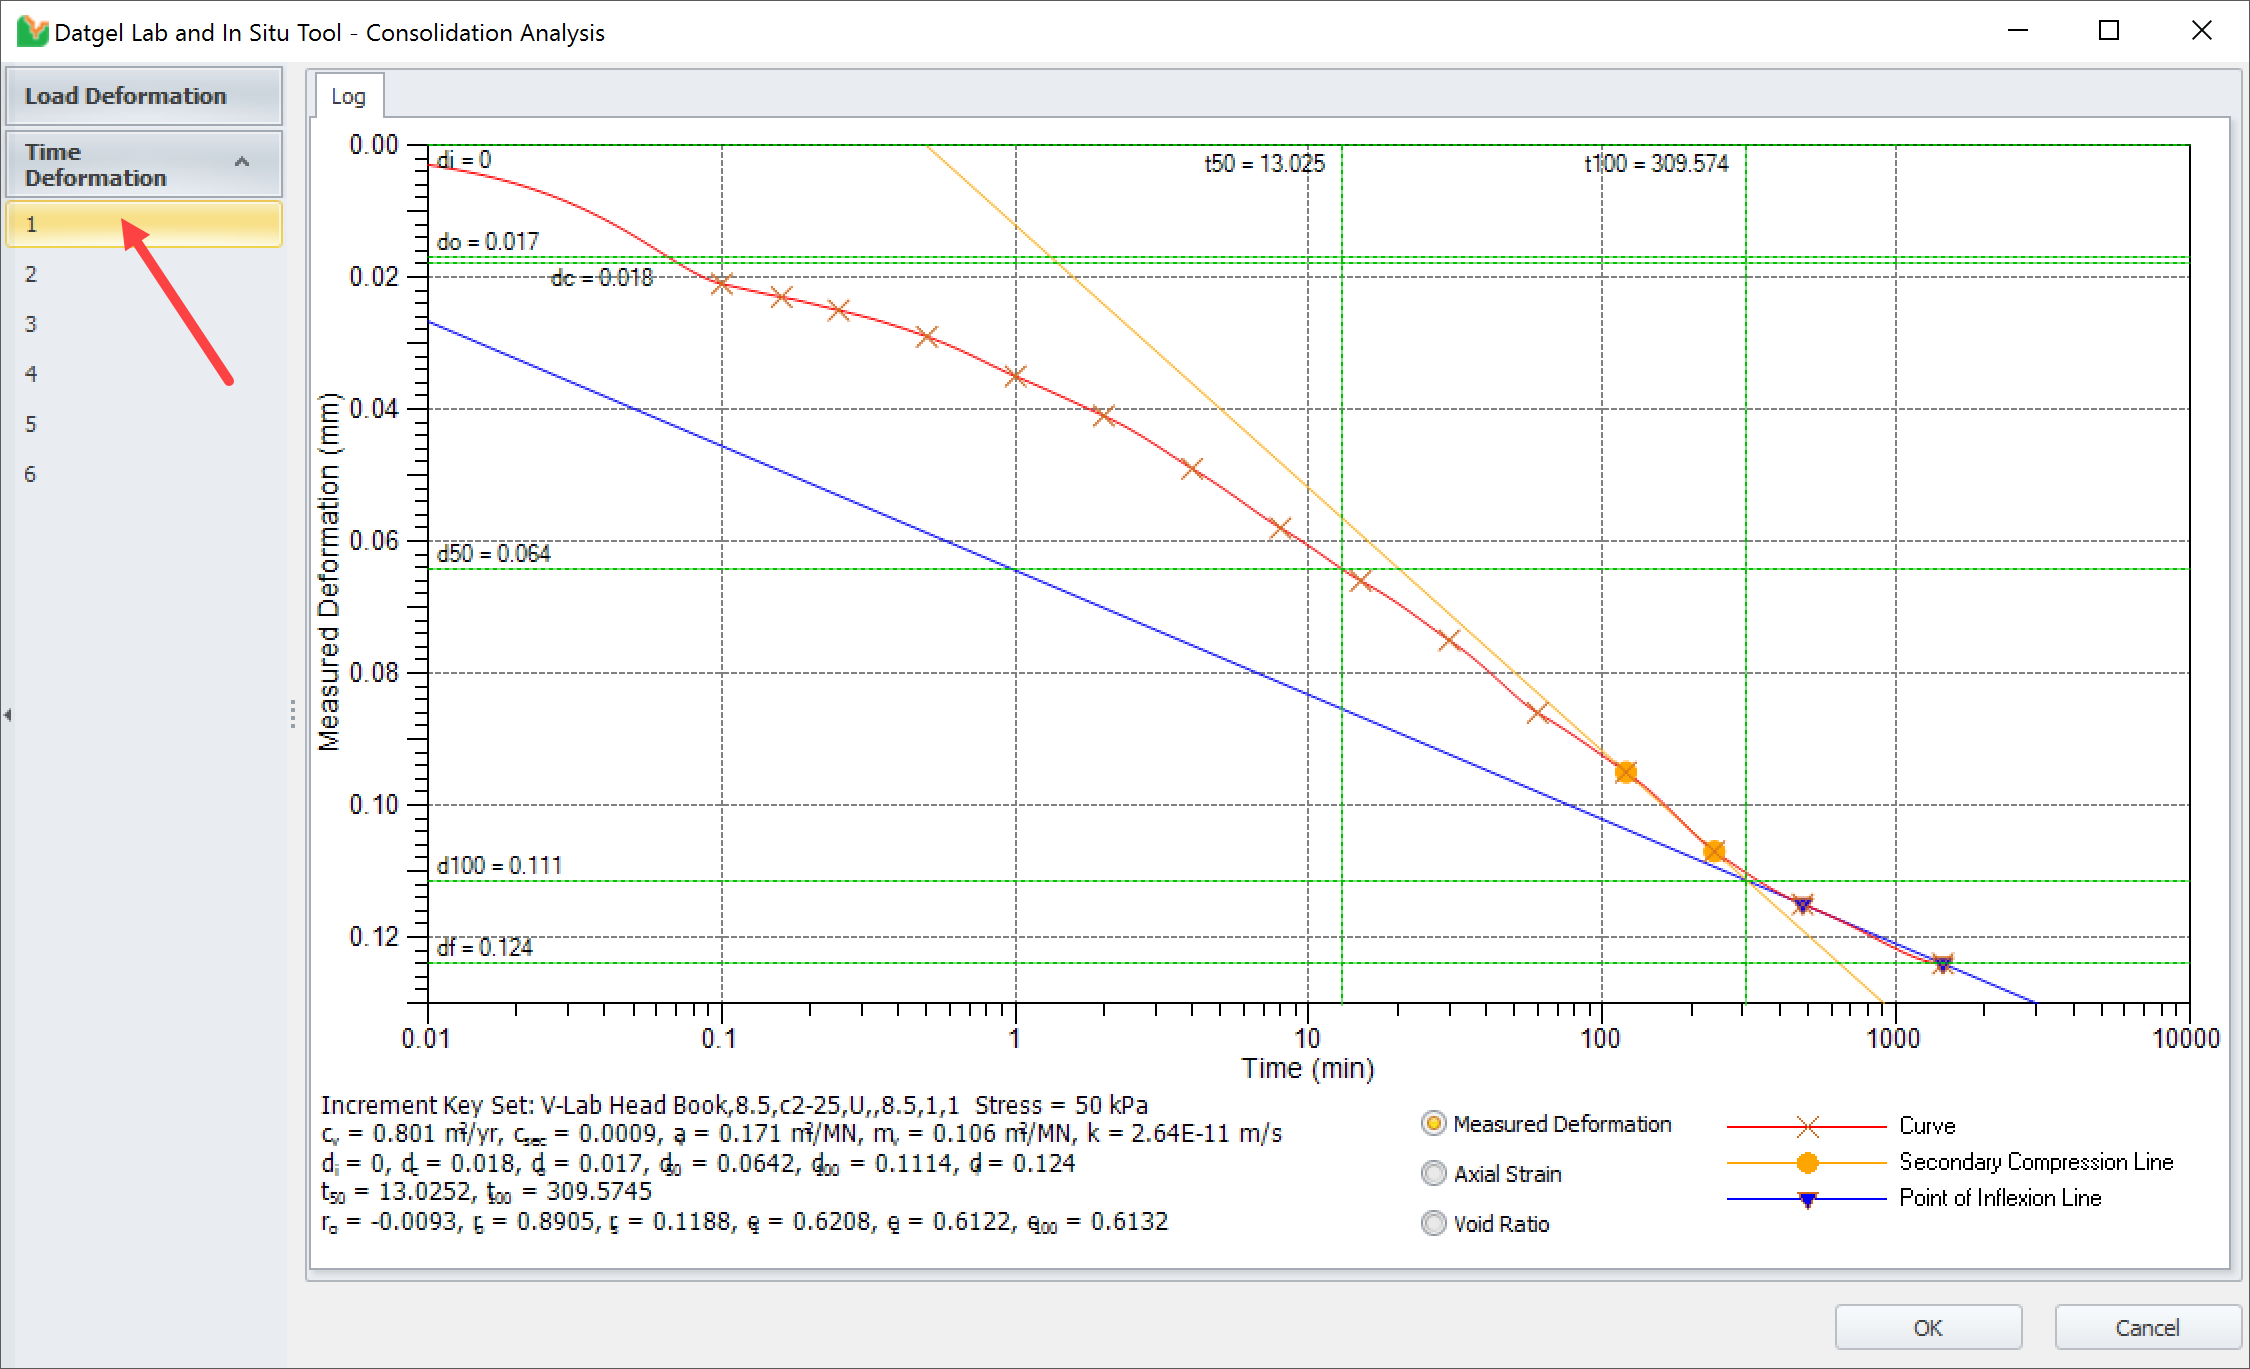
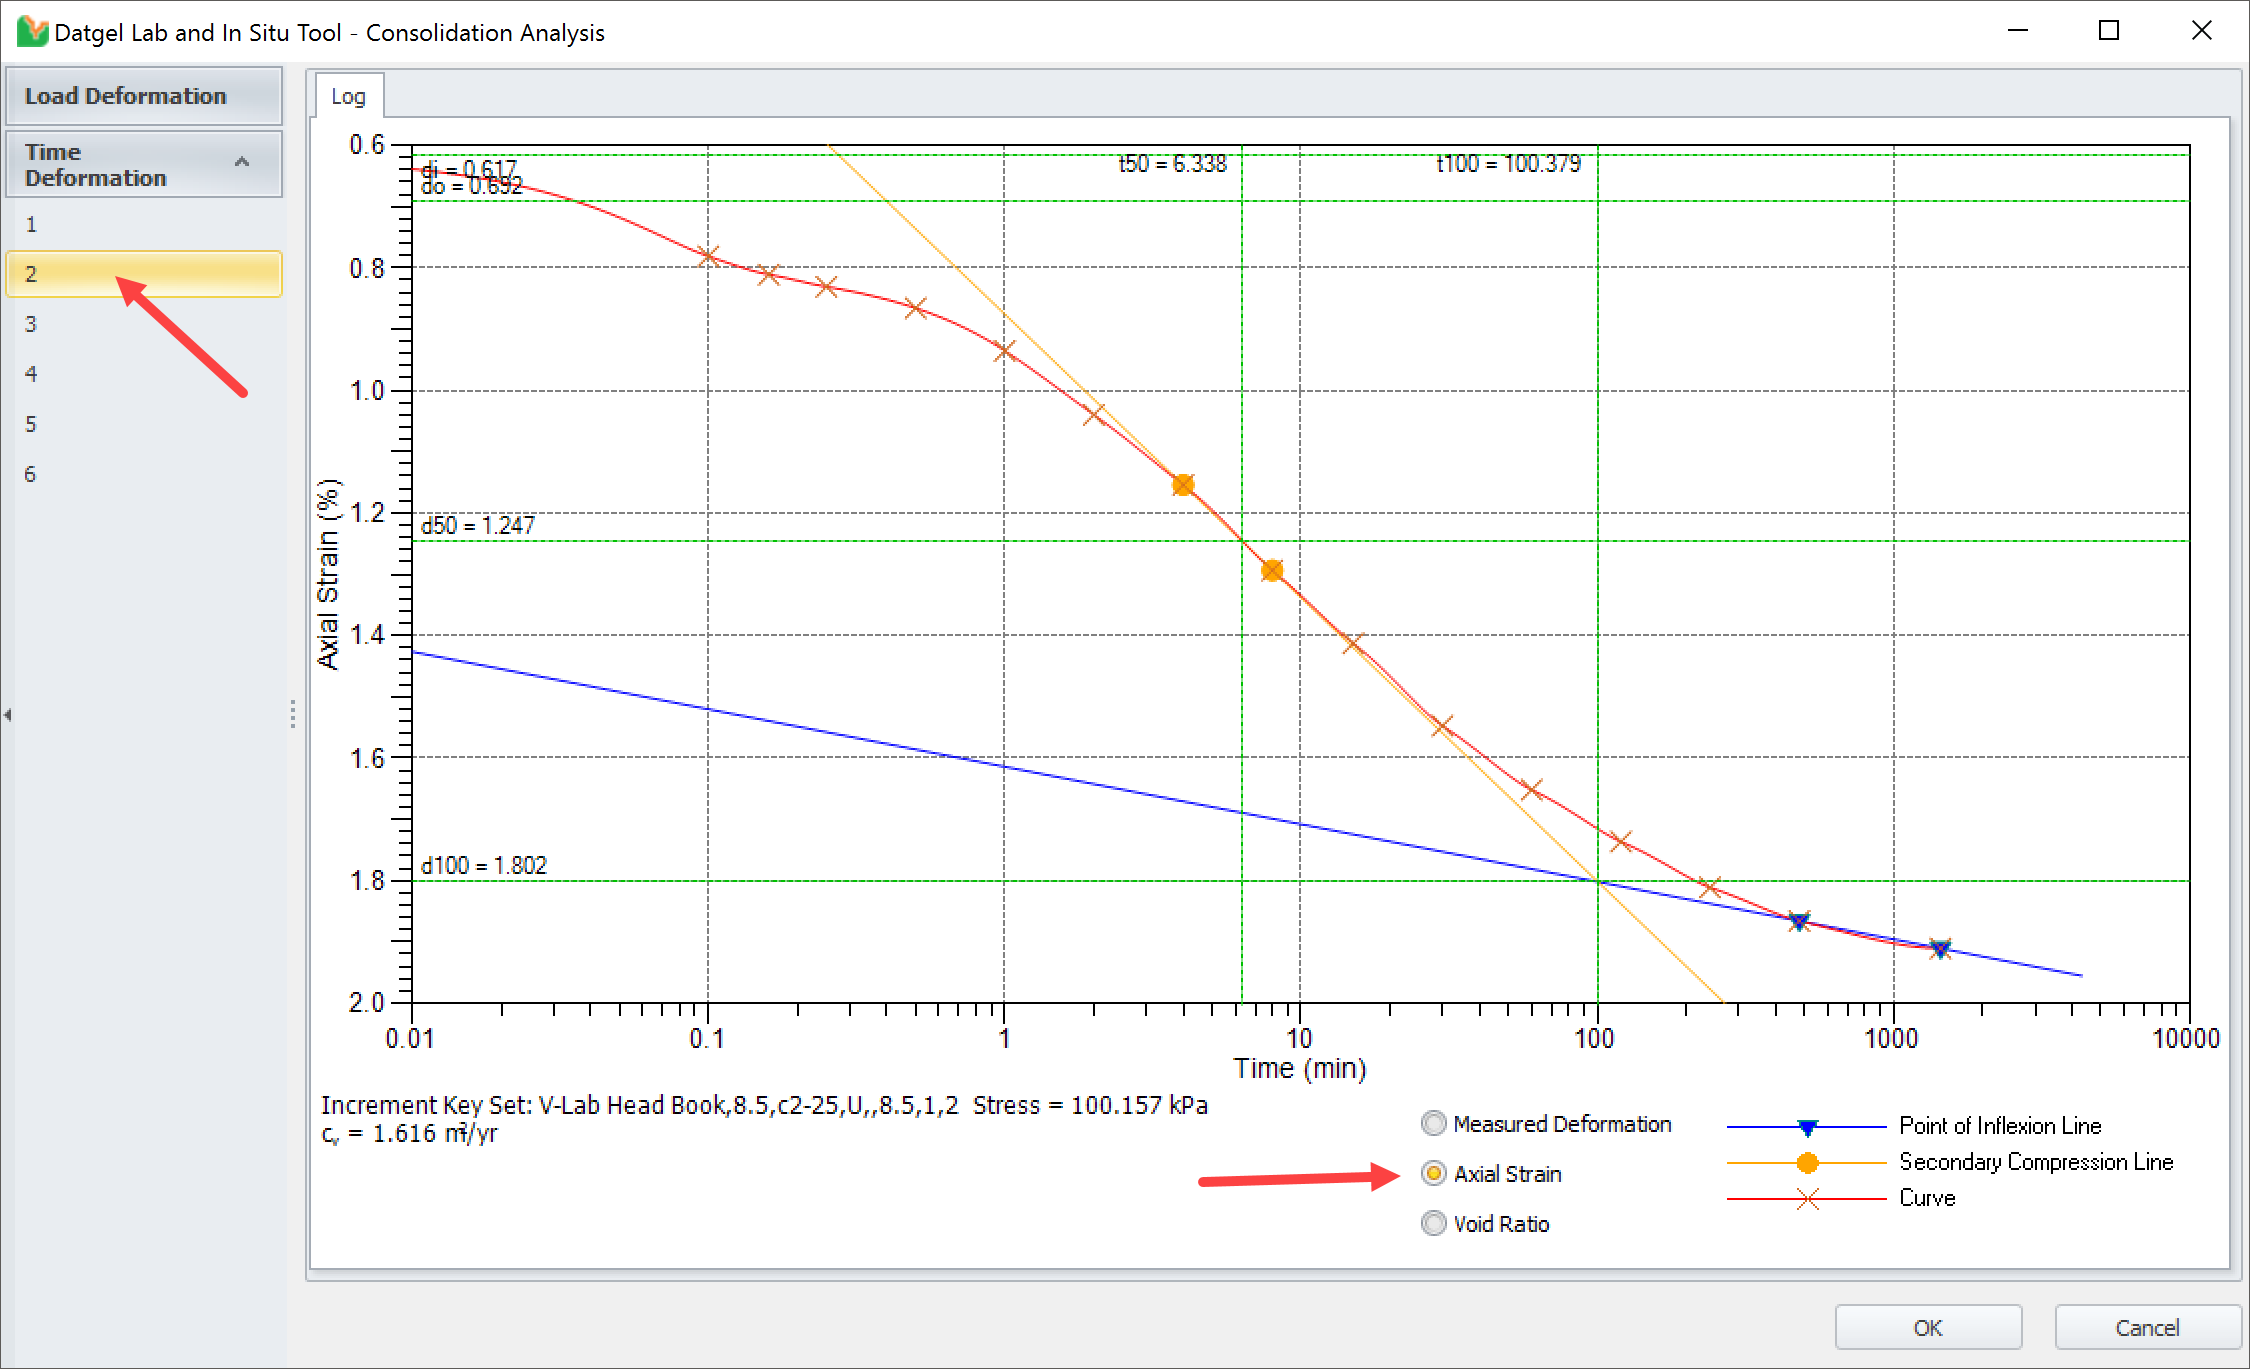
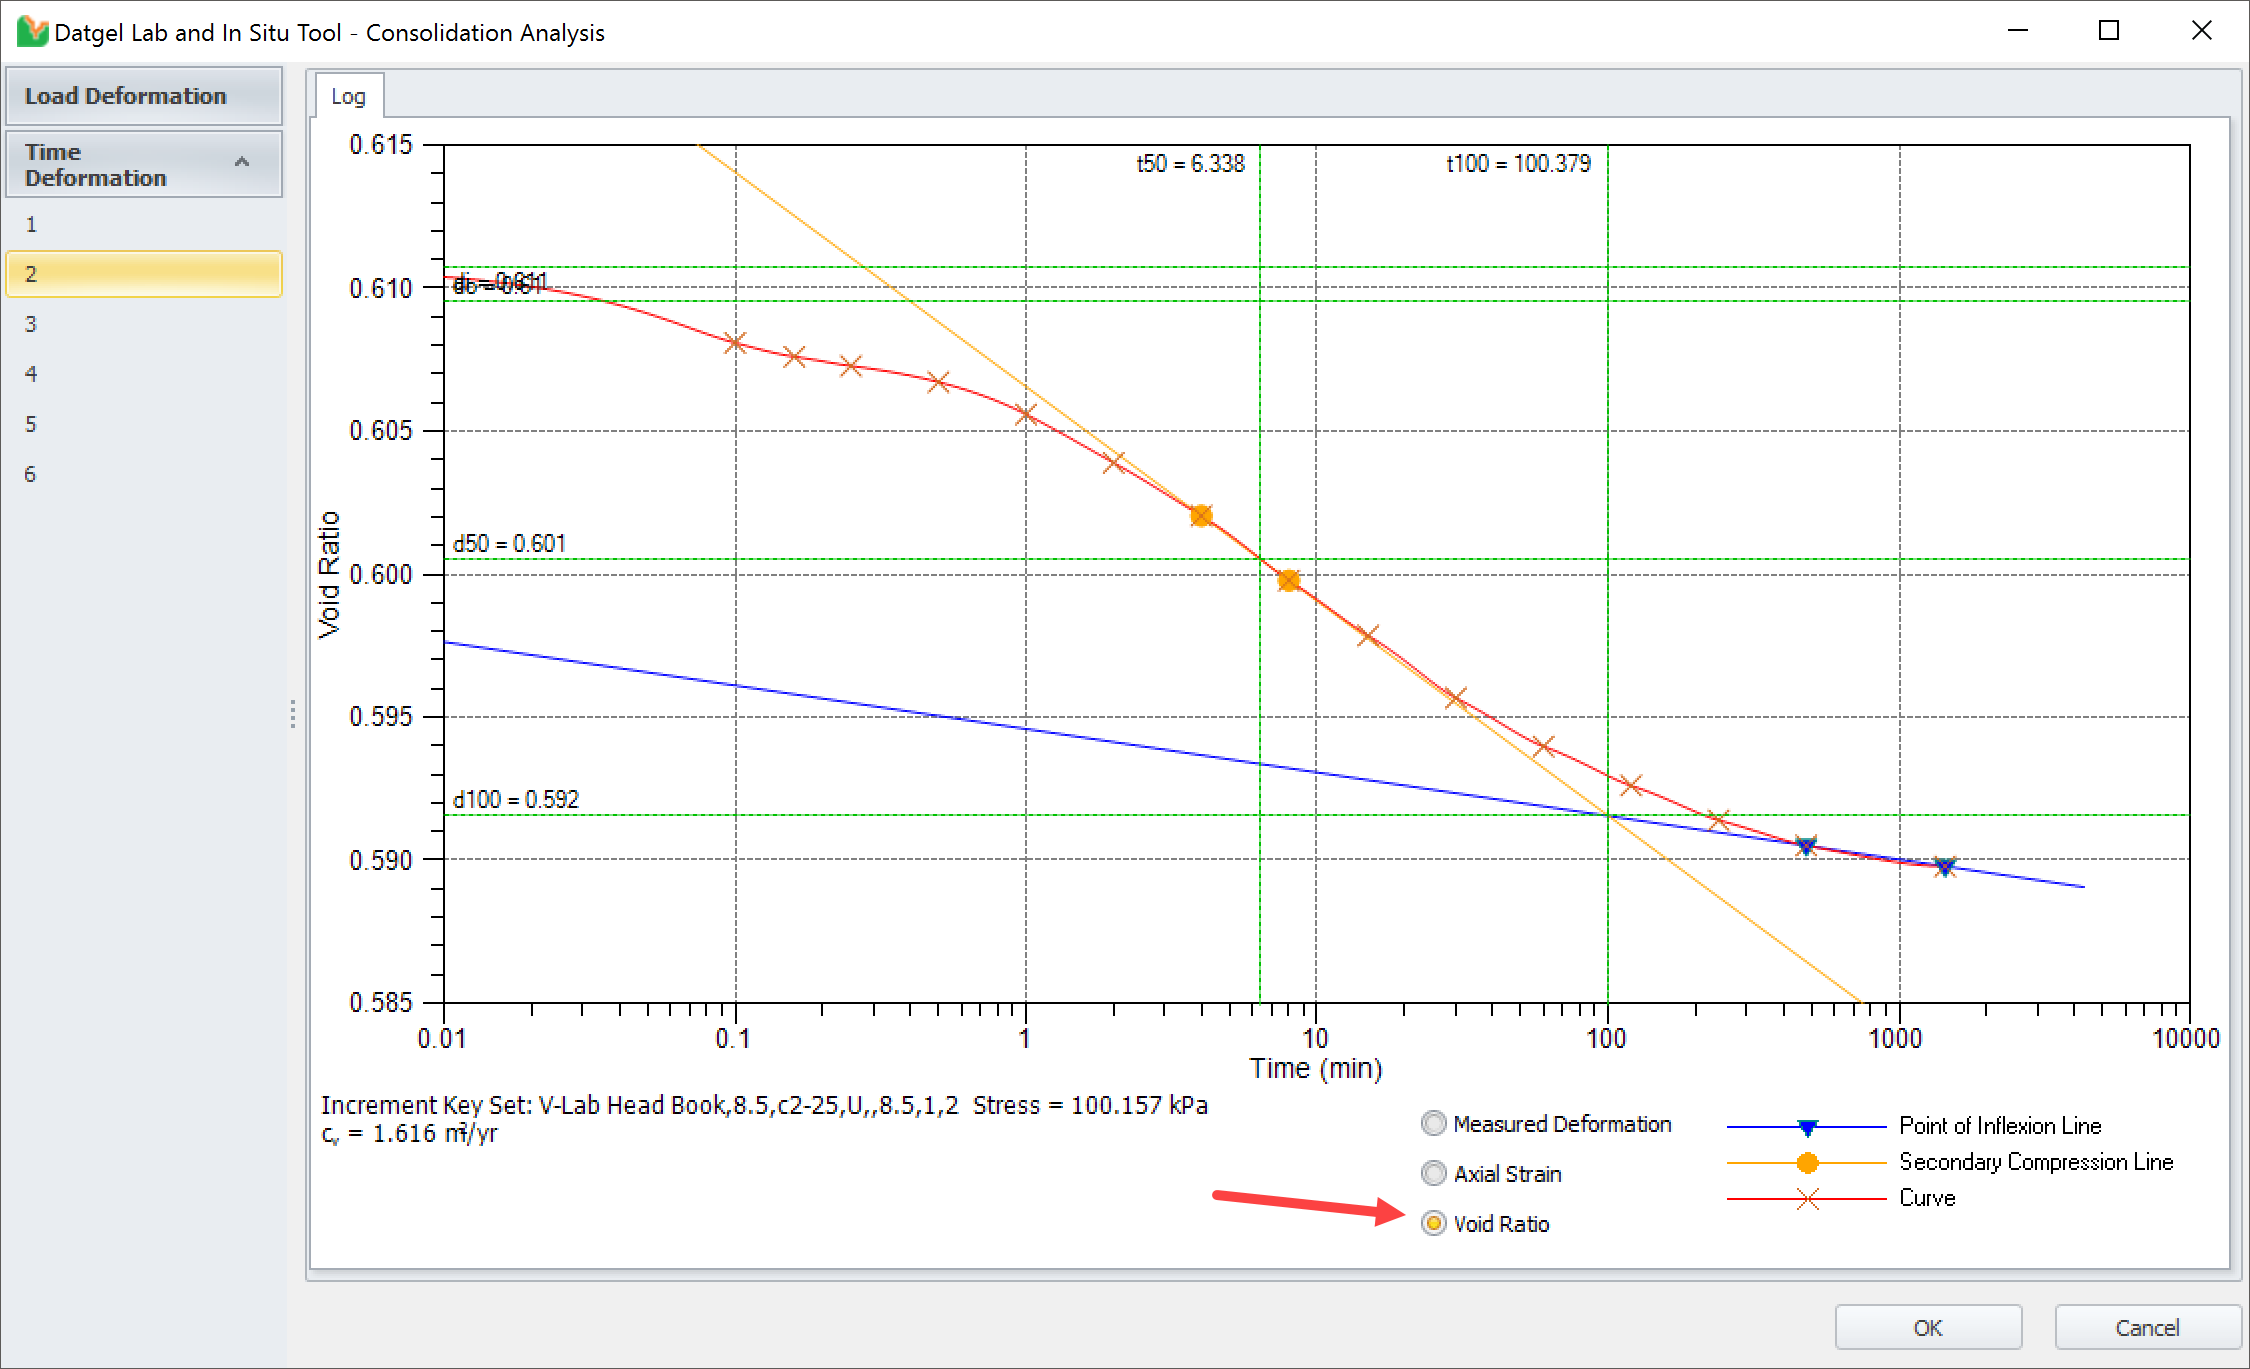
The Y axis (Measured Deformation, Axial Strain or Void Ratio) can be selected for each increment graph by clicking on the desired bullet in the lower frame of the graph as shown in next set of figures..
You must click on all Time Deformation graph to initiate the calculations for each increment of the consolidation test.
After you have reviewed all increment graphs, click Ok and calculation results will be written to the related tables (Consolidation and Consolidation_Increment)
Output
- Graph Report | L S 1D CONS DEF VS TIME A4P (Should be printed 1 specimen by run, due to a gINT limitation)
- Graph Report | L S 1D CONS DEF VS TIME LETP (Should be printed 1 specimen by run, due to a gINT limitation)
- Graph Report | L S 1D CONS E VS AXIAL EFF STRESS A4P
- Graph Report | L S 1D CONS E VS AXIAL EFF STRESS LETP
- Graph Report | L S 1D CONS E VS COEF CONSOL A4P
- Graph Report | L S 1D CONS E VS AXIAL EFF STRESS LETP