Direct Shear
Supported Test Methods
Standard | Description |
|---|---|
ASTM D 3080-04 | Direct shear test of soils under consolidated drained |
BS1377-7:1990:4.5.4 | Determination of shear strength by direct shear (small shear box) – single stage |
BS1377-7:1990:4.5.5 | Determination of shear strength by direct shear (small shear box) – multi-reversal |
BS1377-7:1990:5.5.4 | Determination of shear strength by direct shear (large shear box) – single stage |
BS1377-7:1990:5.5.5 | Determination of shear strength by direct shear (large shear box) – multi-reversal |
Input
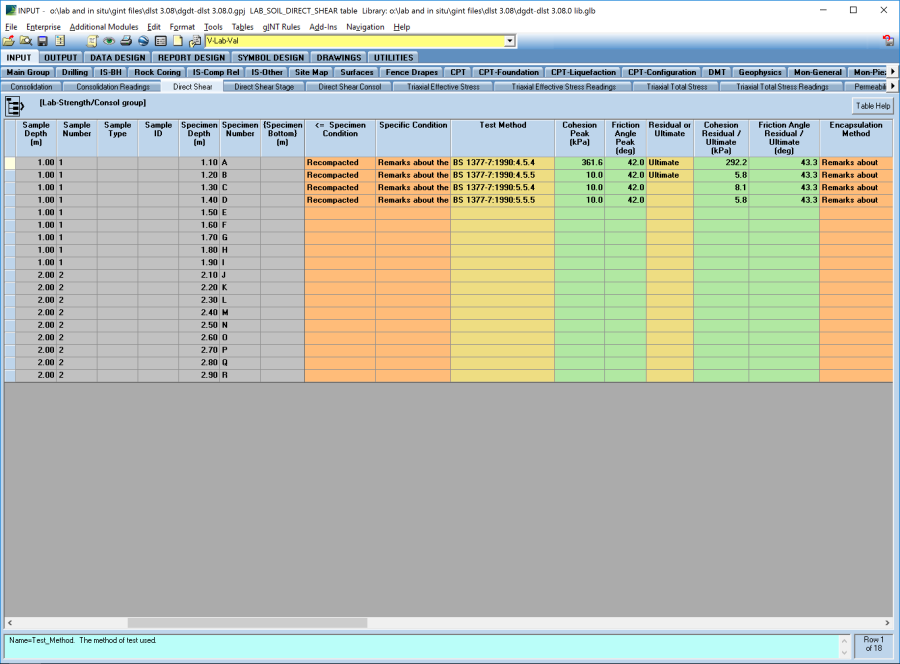
Lab-Strength/Consol | Direct Shear
To calculate the Direct Shear Values of a specimen, you must first select the standard from the Test Method field on the Direct_Shear table that the specimen is being tested against. Once selected, the necessary data entry fields will be automatically highlighted to assist you in entering the relevant data in the Direct_Shear_Stage table for the selected test method.
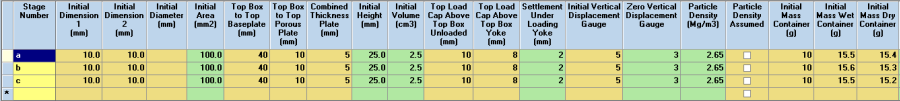
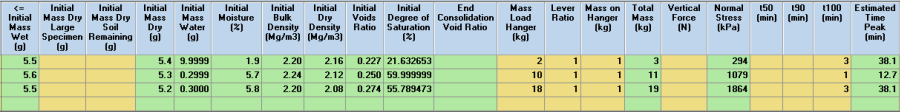
Enter the direct shear stage number data in the data entry fields on Direct_Shear_Stage (upper) table for each stage.


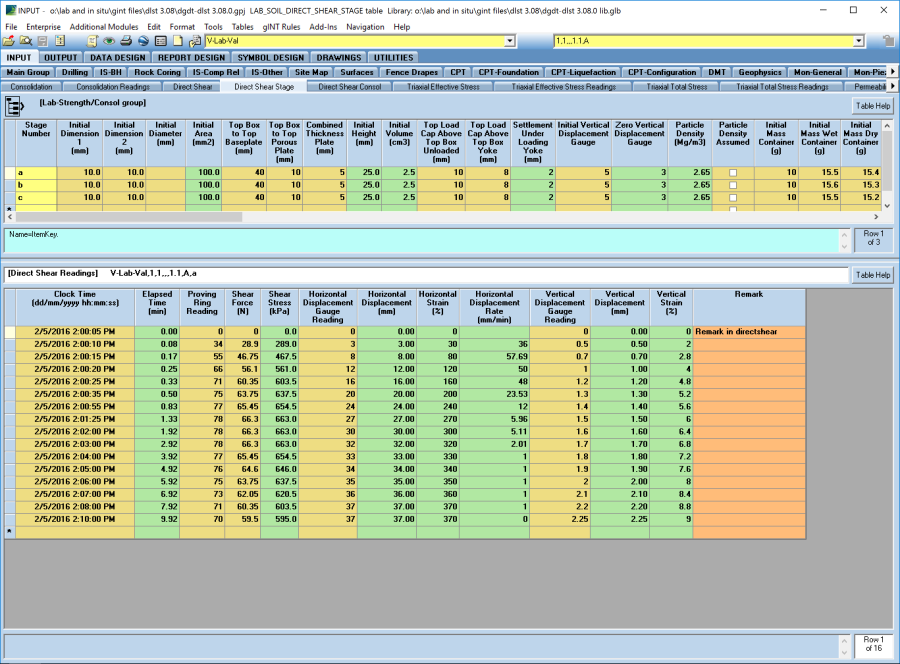
Enter the test data in the data entry fields on the on Direct_Shear_Stage (lower) table for each stage and when you change table or select save, the values will be calculated automatically and the result will be displayed in the calculated fields.
Enter the test data in the data entry fields on the on Direct_Shear_Consol table for each stage and when you change table or select save, the values will be calculated automatically and the result will be displayed in the calculated fields.

Direct Shear Results
To determine direct shear results from the direct shear plot, select Add-Ins > Datgel Lab Tool > Direct Shear Graph to launch the compaction curve plot based on the recorded test data.
You must be on the Direct Shear table to launch the add-in.

The initial plot displayed by the Datgel Lab Tool is based on the test data entered into you gINT database and can be manually refined should it be necessary.
The Cohesion value can be set to zero by checking the Cohesion box.
If you are satisfied with the direct shear plot, click Ok and you will be returned to the gINT Input screen and if you move to the Direct Shear table, you will see that the Cohesion_Peak, Friction_Angle_Peak, Cohesion_Residual / Ultimate and Friction_Angle_Residual / Ultimate fields have been populated based on the direct shear graph.
If you are not satisfied with the defined compaction curve, click Cancel.
Output
- Graph Report | L S DIRECT SHEAR - CONSOL SQRT
- Graph Report | L S DIRECT SHEAR – H ST VS H DISP
- Graph Report | L S DIRECT SHEAR – H ST VS V ST
- Graph Report | L S DIRECT SHEAR – C- CONSOL LOG
- Graph Report | L S DIRECT SHEAR – C- CONSOL SQRT
- Graph Report | L S DIRECT SHEAR – C- SH ST VS H DIS
- Graph Report | L S DIRECT SHEAR – C- V DIS VS H DIS