Using Fence Reports
Output
Fence Reports for range of page sizes and orientations have been set up, and they all operate the same way.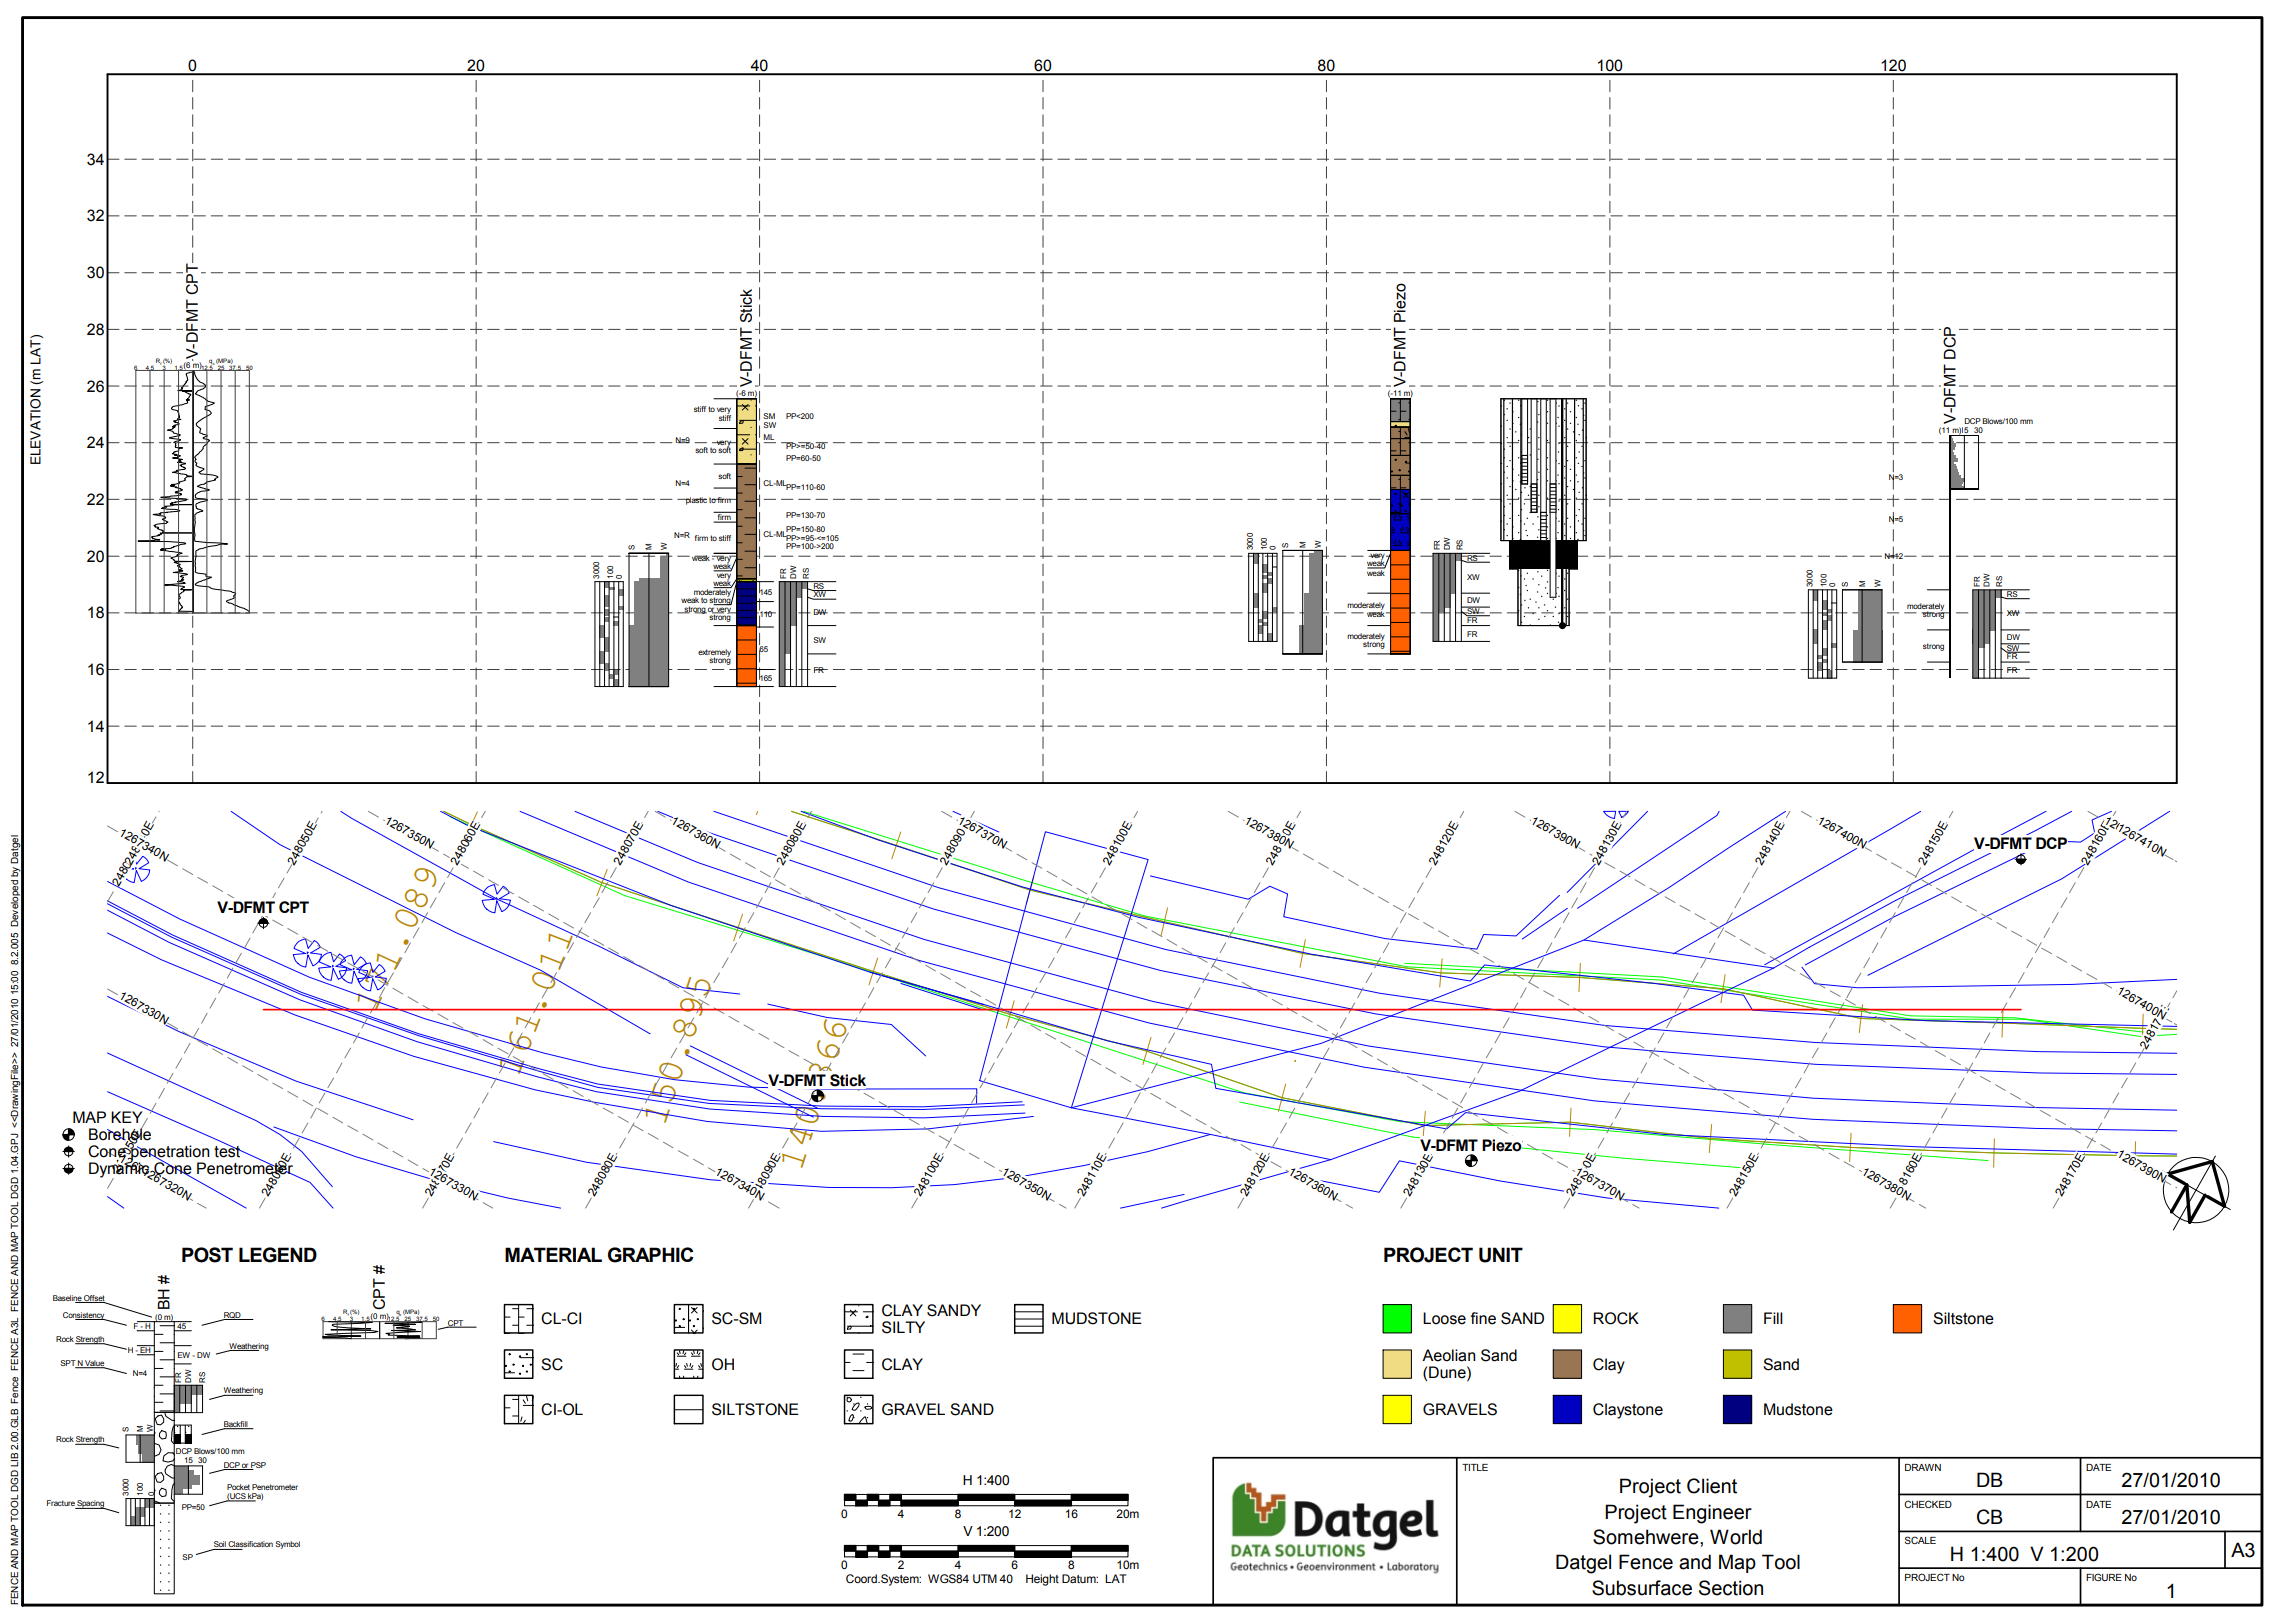
User Report Variables
The user report variables can be used to define the details of the title block, the properties of the site map and how the entities are displayed on the Fence Report. They appear when you output a report. A list of the user report variables and an explanation of how they are used is provided below in Table.
In the following table is a list of Report User Variables. If the value of a Report User Variable is L# / R#, it means that: if a L is entered in these fields will print the info on the left side of the fence posts and R will print the info on the right side; if data exists for that hole. Enter a number after L or R to offset the entity in that direction by that number in mm. For example, L10 will print the entity on the left side offset by 10 mm.
Name | Value | Description |
|---|---|---|
Title | Subsurface Section | Report title |
Drawn | Enter person's initials/name | |
Drawn Date | Enter date (dd/mm/yyyy) | |
Checked | Enter person's initials/name | |
Checked Date | Enter date (dd/mm/yyyy) | |
Figure Number | Enter text. If left blank, it will default to "Figure 1". | |
Map Orientation | B, N | Sets the orientation of the site map. B = Baseline end points (default), N = North up |
Override Sitemap Scale | 1 (for 1:1000) | Overrides the scale of the site map by the selected value. By default the site map scale is the same as the fence x axis |
Sitemap Lower Left Corner East | Overrides the coordinates of the lower left hand corner of the site map to the specified coordinates (m). | |
Sitemap Lower Left Corner North | ||
Sitemap Angle Relative North CCW | Rotates the site map counter-clockwise through the specified angle (deg). If the coordinates of the lower left corner are specified, the rotation is centred on the lower left corner, otherwise it is centred on the centre of the site map entities | |
Stick | L | L = Legend/material graphic (default) S = Stick/Line OR = Origin Colour C = CPT Soil Behaviour Type Colour L OR = Legend / Material Graphic and Origin Colour L C = Legend / CPT Soil Behaviour Type Colour DGD Only: GU1 = Geology Project Unit 1 Colour GU2 = Geology Project Unit 2 Colour GUD = Geology Project Unit 1 & 2 Colour GU3 = Geology Project Unit 3 Colour L GU1 = Legend / Material Graphic with Geology Project Unit 1 Colour L GU2 = Legend / Material Graphic with Geology Project Unit 2 Colour L GU3 = Legend / Material Graphic with Geology Project Unit 3 Colour GF1 = Geology Project Unit 1 Fill GF2 = Geology Project Unit 2 Fill GFD = Geology Project Unit 1 & 2 Fill GF3 = Geology Project Unit 3 Fill AGS RTA only: G1 = Geology Project Unit 1 Colour G2 = Geology Project Unit 2 Colour GD = Geology Project Unit 1 & 2 Colour GM = Geology Map Code Colour GG = Geology Project Unit from General Symbols L G1 = Legend / Material Graphic and Geology Project Unit Colour L G2 = Legend / Material Graphic and Geology Project Unit 2 Colour L GM = Legend / Material Graphic and Geology Map Code Colour |
Stick CPT | S | |
Stick DCP | L | |
Stick Width | # | Allows the user to set the stick width in mm |
Coloured Graphic Log | Black, General Symbol, Origin | Sets the graphic log colour source, leave blank for default colour. |
Black: Override all colours to Black | ||
General Symbol: General Symbols will be used instead of the default Material Symbols | ||
Origin: Material Symbols set to origin colour | ||
Post Header Text | Lookup | Multiple options for the position and orientation of the post header |
EOH Text | Lookup | Multiple options to print hole depth and elevation at bottom of fence post |
Text Height Extra Large | # | The user can set the Text Height in mm. As an example, Extra Large = 3, Large = 2.5, Medium = 1.75 and Small = 1.25. The Default values are: Extra Large = 2, Large = 1.5, Medium = 1 and Small = 0.75. |
Text Height Large | # | |
Text Height Medium | # | |
Text Height Small | # | |
Scope Geology Unit Legend | Project, Current Fence | Defines the scope of the geology unit legend |
Depth Scale | L# / R# | L entered in these fields will print the info on the left side of the fence posts and R will print the info on the right side; if data exists for that hole. |
Depth Scale Option | Auto, 1 | Auto - scale the interval automatically |
1 – always 1 m | ||
Material Name | L# / R# | |
Graphic Name | L# / R# | |
Material Graphic Scale | x1 (by default), x0.5, x0.75, x1.25, x1.5, x1.75, x20. | |
Graphic Legend Elevation | L# / R# | |
Origin Text | L# / R# | |
Formation Text | L# / R# | Only applies to DGD, data on STRATA_SOIL_BS |
Geology Unit 1 Text | L# / R# | |
Geology Unit 2 Text | L# / R# | |
Geology Unit 3 Text | L# / R# | |
Geology Unit 1-2 Text | L# / R# | Only applies to DGD |
Unit Elevation | L# / R# | |
USCS Text | L# / R# | |
VS Text | L# / R# | |
SPT N Text | L# / R# | |
SPT N Text Option | N=# or N# | Defines the N SPT Format |
SPT N Plot | L# / R# | The maximum scale is stored in SPT N Value on Plots for Refusal table Options | Project Options, otherwise 50. |
SPT N Plot Option | Red Dot, Line and Number | |
SPT N and RQD Plot | L# / R# | |
SPT N Plot Scale Position | Min closest to stick (by default), Max closest to stick, Min-Max, Max-Min | |
SPT N and RQD Plot Scale Position | Min closest to stick (by default), Max closest to stick, Min-Max, Max-Min | |
Pocket Penetrometer Text | L# / R# | |
Torvane Test Text | L# / R# | |
Lab Vane Test Text | L# / R# | |
| Su from PP Text | L# / R# | |
Sample Interval | L# / R# | |
Sample Text | L# / R# | |
Display Core Sample Text | Y/N | Checked by Default |
Consistency Text | L# / R# | |
Rock Strength Text | L# / R# | |
Rock Strength Histogram | L# / R# | |
Rock Strength Histogram Scale Position | Min closest to stick (by default), Max closest to stick, Min-Max, Max-Min | |
Rock Strength Bar Plot | L# / R# | |
Rock Strength Bar Plot Scale Position | Min closest to stick (by default), Max closest to stick, Min-Max, Max-Min | |
Display Point Load Test | Y/N | |
Fracture Spacing Histogram | L# / R# | |
Fracture Spacing Hist Scale Position | Min closest to stick (by default), Max closest to stick, Min-Max, Max-Min | |
Fracture Spacing Bar Chart | L# / R# | |
Fracture Spacing Bar Chart Scale Pos | Min closest to stick (by default), Max closest to stick, Min-Max, Max-Min | |
Fracture Frequency Plot | L# / R# | |
Fracture Frequency Plot Scale Position | Min closest to stick (by default), Max closest to stick, Min-Max, Max-Min | |
Weathering Text | L# / R# | |
Weathering Histogram | L# / R# | |
Weathering Histogram Scale Position | Min closest to stick (by default), Max closest to stick, Min-Max, Max-Min | |
Weathering Bar Chart | L# / R# | |
Weathering Bar Chart Scale Position | Min closest to stick (by default), Max closest to stick, Min-Max, Max-Min | |
TCR Histogram | L# / R# | |
TCR Histogram Scale Position | Min closest to stick (by default), Max closest to stick, Min-Max, Max-Min | |
RQD Histogram | L# / R# | |
RQD Histogram Scale Position | Min closest to stick (by default), Max closest to stick, Min-Max, Max-Min | |
Core Histogram Option | Solid & Hollow | Defines the histogram format. |
TCR Text | L# / R# | |
RQD Text | L# / R# | |
RMR Histogram | L# / R# | |
RMR Histogram Scale Position | Min closest to stick (by default), Max closest to stick, Min-Max, Max-Min | |
Core Loss | L# / R# | |
Major Defects | Y/N | |
Defect Line | L# / R# / C | |
DCP Plot | L# / R# | |
DCP Column Width | # | Defines the width (mm) of the DCP column |
DCP Max Value | # | Defines the maximum value of the DCP column scale |
DCP Plot Scale Position | Min closest to stick (by default), Max closest to stick, Min-Max, Max-Min | |
qc qt Max Scale | 5, 10, 20, 40 | |
qc Rf Plot | t, c | |
Core Image Column Type | VSC, CPC, DIC, VSC & CPC | The Type of Core Column field determines which core photo column type to print on the fence posts. The available options are: VSC (Visual Sketch Column), CPC (Core Photo Column), DIC (Downhole Image Column) and VSC & CPC (Visual Sketch Column and Core Photo Column. The Core Image Column field determines whether to print the core photo column on the left or right side of the fence posts. This field must be assigned a value when the type of Core Column field is assigned. |
Core Image Column Position | L# / R# | |
Drilling Water Levels | L# / R# | |
Piezo Levels | L# / R# | |
iezo Static Level | L# / R# | A level symbol and line when field [MON_PIEZOMETER_READINGS].[Static] is checked |
Backfill | L# / R# | The Backfill field will print the piezometer column if data is found in the Piezometer table. Otherwise, it will print the well column from the Backfill/Well table. |
Well Area Width | # | Well Area Width defines the width (mm) of the backfill column |
In situ Perm Text | L# / R# | |
In situ Perm K Plot | L# / R# | |
In situ Perm K Plot Scale Position | Min closest to stick (by default), Max closest to stick, Min-Max, Max-Min | |
In situ Perm Lugeon Plot | L# / R# | |
In situ Perm Lugeon Plot Scale Position | Min closest to stick (by default), Max closest to stick, Min-Max, Max-Min | |
In situ Density | L# / R# | |
In situ Density Scale Position | Min closest to stick (by default), Max closest to stick, Min-Max, Max-Min | |
Lab USCS Text | L# / R# | |
PSD Percent Fines Text | L# / R# | |
PSD D50 Text | L# / R# | |
PSD DMF Text | L# / R# | |
Plasticity Index Text | L# / R# | |
Liquidity Index Text | L# / R# | |
Moisture Content Text | L# / R# | |
Dry Density Text | L# / R# | |
Bulk Density Text | L# / R# | |
Emerson Class Text | L# / R# | |
Consolidation Text | L# / R# | |
Lab CBR Text | L# / R# | |
OCR Text | L# / R# | |
Direct Shear Text | L# / R# | |
Compaction Text | L# / R# | |
Triaxial Effective Stress Text | L# / R# | |
Triaxial Total Stress Text | L# / R# | |
Shrink-Swell Index Text | L# / R# | |
Point Load Index Text | L# / R# | |
UCS Text | L# / R# | |
Rock Tensile Strength Text | L# / R# | |
Ten Percent Fines Text | L# / R# | |
Organic Matter Text | L# / R# | Only applies to DGD |
pH Text | L# / R# | Only applies to DGD |
Carbonate Content Text | L# / R# | Only applies to DGD |
Sulphate Content Text | L# / R# | Only applies to DGD |
Chloride Content Text | L# / R# | |
Suspended Solids Text | L# / R# | Only applies to DGD |
Acid Sulphate Soil Text | L# / R# | |
Loss On Ignition Text | L# / R# | Only applies to DGD |
Resistivity Text | L# / R# | |
Thermal Conductivity Text | L# / R# | Only applies to DGD |
ASS Display Liming Rate Net | Y/N | Note: Scr cannot be shown with SPOS. If both Scr and SOS are checked, then Scr will be shown. |
ASS Scr | Y/N | |
ASS SPOS | Y/N | |
ASS Net Acidity | Y/N | |
ASS Potential | Y/N | |
ASS Criteria | Q,T | Entering Q will post the QASSIT Criteria data on the fence posts, and entering T will post the ASS Types on the fence posts. |
ASS Left Offset | # | Distance in mm the ASS entities on the left / right side of the post will offset, default is 0.
|
ASS Right Offset | # | |
Geotech Chem Plot Left Code | Lookup | Geotech Chem Plot Left Code: To select the chemical test to print. Geotech Chem Plot Left will print a graph with the results stored in the Geotechnical Chemistry table (Lab-Chem Group) in the Left side of the stick. To print a graph: |
Geotech Chem Plot Left Test Type | Lookup | Geotech Chem Plot Left Test Type: To select the Test Type. |
Geotech Chem Plot Left Code Unit | Lookup | Geotech Chem Plot Left Code Unit: Select the unit of the result. |
Geotech Chem Plot Left Minimum | # | Geotech Chem Plot Left Minimum and Maximum are the limit values of the scale in the printed graph. |
Geotech Chem Plot Left Maximum | # | |
Geotech Chem Plot Right Code | Lookup | Same functionality as the Geotech Chem Plot Left. In this case the graph will be printed in the right side |
Geotech Chem Plot Right Test Type | Lookup | |
Geotech Chem Plot Right Code Unit | Lookup | |
Geotech Chem Plot Right Minimum | # | |
Geotech Chem Plot Right Maximum | # | |
Geotech Chem Plot Scale Position | Min closest to stick (by default), Max closest to stick, Min-Max, Max-Min |
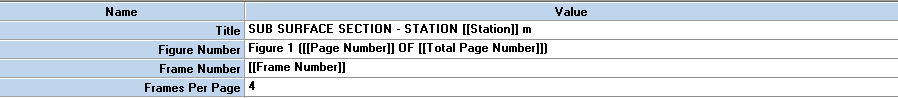
Fence Output Tool is designed to work with reports FENCE CROSS SECTION 2 X 2 A3L and FENCE MAP CROSS SECTION 1 X 1 A3L. These have special place holders in some URV.
The following image shows a standard reports user report variables.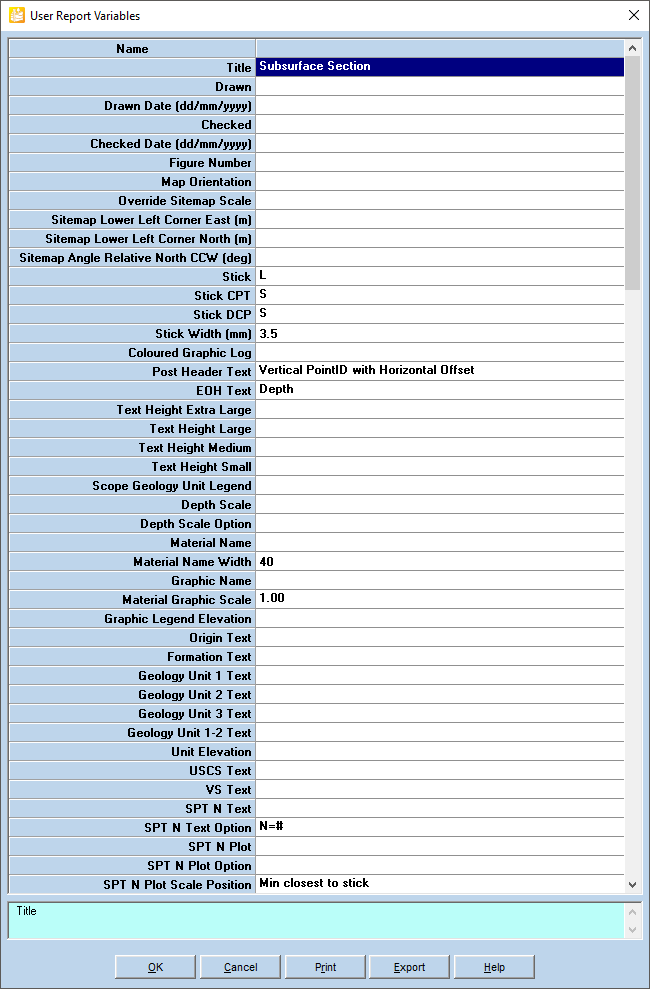
Post Legend Example
