Report Symbology
The Symbology feature in the CPT Tool provides a way to dynamically configure the output and presentation of derived parameter and correlation plots and text entities in the CPT gINT reports with relative ease. Almost all aspects of the entities are configurable, from the plot line colour/type, minimum/maximum scale, to units and header text.
Symbology Table Structure
The Symbology configuration can be applied to differing levels of scope, from the Library (global), Project and PointID. On output of a report, the configuration in the PointID level takes precedence over Project, followed by Library. If no configuration exists for the PointID level, it will look to the Project level, then Library. This hierarchical system allows you to configure differing sets of configuration to a particular project, or a single/selected group of PointIDs, with the default configuration being in the library.
Library
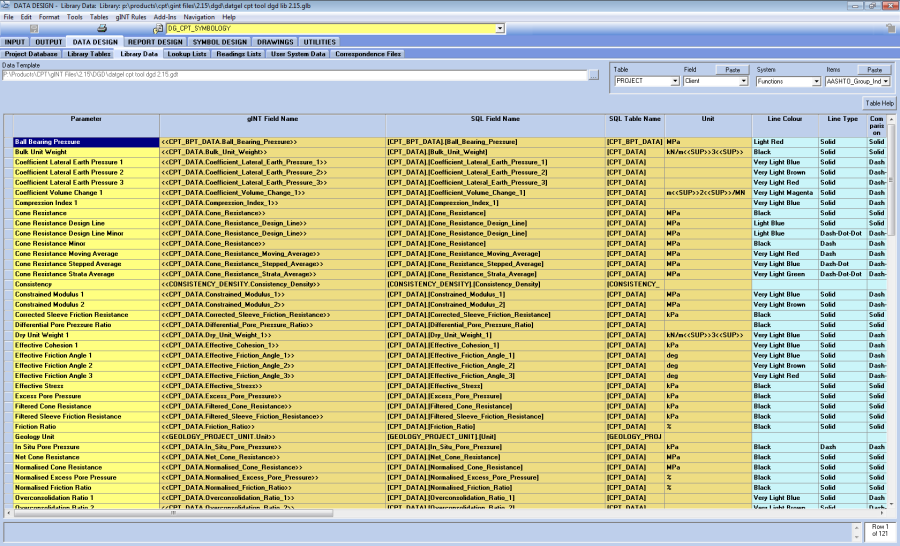
There are two Symbology tables in the gINT library, DG_CPT_SYMBOLOGY and DG_CPT_SYMBOLOGY_SCALES_UNITS.
DG_CPT_SYMBOLOGY is the place to store your default/project level configuration of your CPT derived parameters/correlation entities in your CPT log, fence and graph reports.
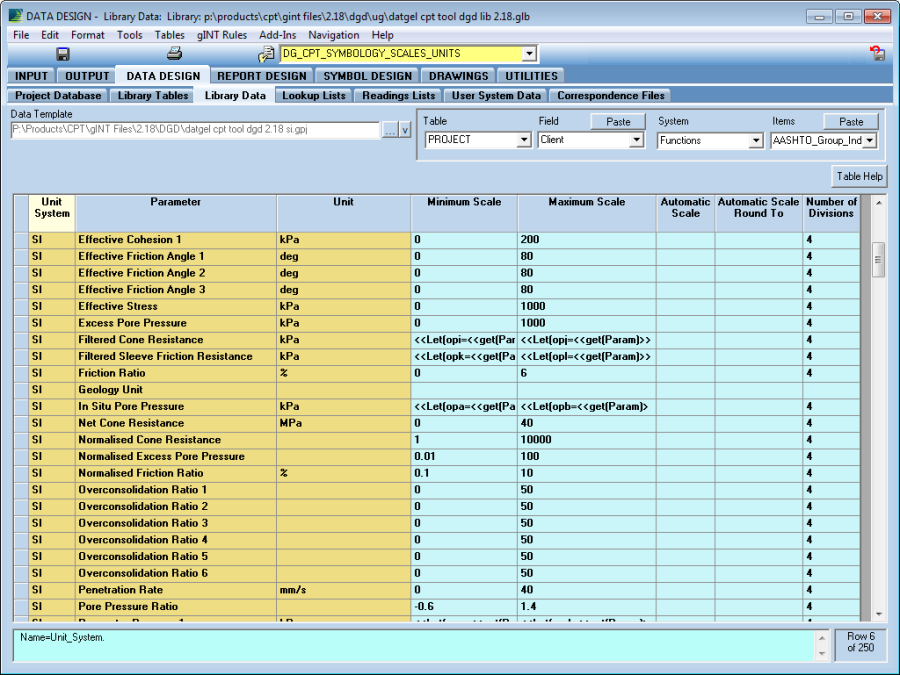
DG_CPT_SYMBOLOGY_SCALES_UNITS is the place to store configuration options that may differ in value depending on the currently selected unit system.
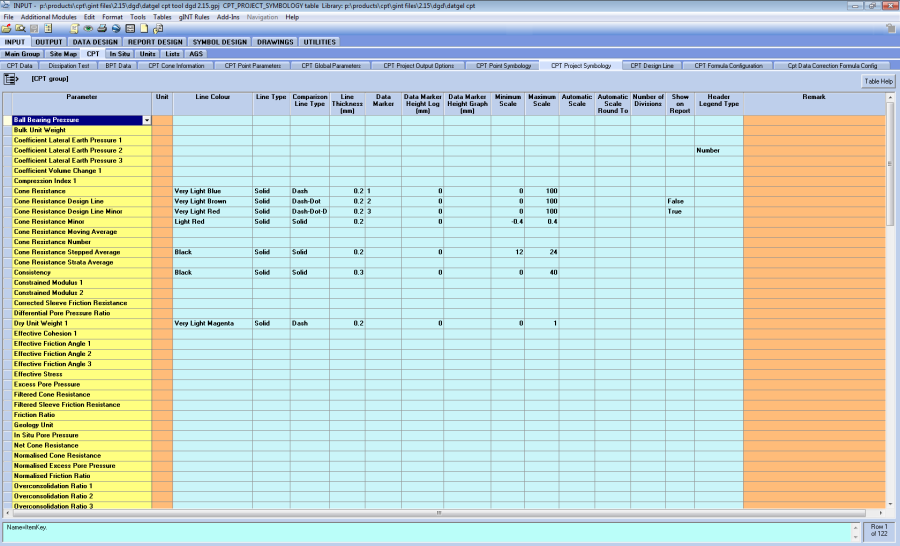
Project
The project-specific Symbology table in the gINT Project database is called CPT_PROJECT_SYMBOLOGY. Configuration values entered here apply to all CPTs in the current project only. Configuration values entered in this table will override the values in the library Symbology table.
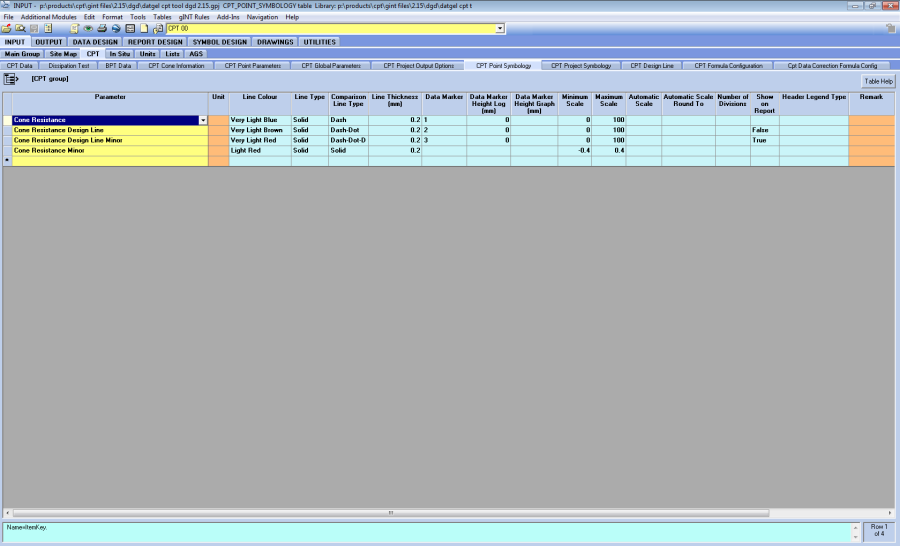
Point
The project-specific Symbology table in the gINT Project database is called CPT_POINT_SYMBOLOGY. Configuration values entered here apply to all CPTs in the current project only. Configuration values entered in this table will override the values in the library Symbology table.
Configurable Options
CPT_SYMBOLOGY
Field Name | Description | Configured In |
|---|---|---|
Parameter | Unique identifier of the correlation or parameter. New Parameters can be added in DG_CPT_SYMBOLOGY only. | Library, Project, Point |
gINT Field Name | Table/Field reference of the parameter. Value is used in the CPT log/fence reports, and must be in <<TABLE.Field>> format. This value should only be modified if you have renamed the corresponding field in your Project database. | Library |
SQL Field Name | Table/Field reference of the parameter. Value is used in SQL Queries in the CPT log/fence reports, and must be in [TABLE].[Field] format. This value should only be modified if you have renamed the corresponding field in your Project database. | Library |
SQL Table Name | Table reference of the parameter. Value is used in SQL Queries in the CPT log/fence reports, and must be in [Table] format. | Library |
Line Colour | Line colour displayed to represent the parameter in the CPT log/fence report plot entities. | Library, Project, Point |
Line Type | Line type displayed to represent the parameter in the CPT log/fence report plot entities. | Library, Project, Point |
Comparison Line Type | Line type displayed to represent the comparison parameter in the comparison CPT log/fence report plot entities. | Library, Project, Point |
Line Thickness | Line thickness displayed to represent the parameter in the CPT log/fence report plot entities. | Library, Project, Point |
Data Marker | Data Marker displayed to represent the parameter in the CPT log/fence report plot entities and graph reports, in millimetres. | Library, Project, Point |
Data Marker Height Log | Height of Data Marker displayed to represent the parameter in the CPT log/fence report plot entities in millimetres. | Library, Project, Point |
Data Marker Height Graph | Height of Data Marker displayed to represent the parameter in the CPT graph reports, in millimetres. | Library, Project, Point |
Show on Report | Enter True to show the parameter in the CPT log/fence report plot entities, False to hide. | Library, Project, Point |
Name | Name of the parameter. This value will appear in the header of the CPT log/Fence report plot entities, and in the axis label of CPT graphs. | Library |
Abbreviation | Abbreviated name of the parameter. This value will appear in the header of the CPT log/Fence report plot entities, and in the axis label of CPT graphs. | Library |
Reference | Reference of the parameter. This value will appear in headers and legends in CPT log, fence and graph reports. | Library |
Reference Short | Shortened reference of the parameter. This value will appear in headers and legends in CPT log and fence reports. | Library |
Header Legend Type | Legend type displayed in the header of CPT log/Fence report plot entities. | Library, Project, Point |
Scale Not Applicable | Check to make the scale fields on point and project symbology grey/read-only | Library |
Design Line Field | Field in the design line data table related to the parameter, set in format [Table}.[Field]. Only set this for parameter 1 of a set of correlations. For example, Coefficient Lateral Earth Pressure 1 has a value of | Library |
DG_CPT_SYMBOLOGY_SCALES_UNITS
Field Name | Description |
|---|---|
Unit System | Unit System the parameter configuration is applicable to |
Parameter | Unique identifier of the correlation or parameter. |
Unit | Unit of the parameter, value will be displayed in the header section of the log/fence column. |
Minimum Scale | Minimum axis scale of the CPT log/fence report plot entities. gINT Expressions can be entered in the library Symbology table only. Numeric values can be entered in all Symbology tables. |
Maximum Scale | Maximum axis scale of the CPT log/fence report plot entities. gINT Expressions can be entered in the library Symbology table only. Numeric values can be entered in all Symbology tables. |
Automatic Scale | Automatically define the minimum and maximum scale for the CPT log/fence report plot entity. |
Automatic Scale Round To | Number of decimal places to round the minimum and maximum scales to, if Automatic Scale is used. |
Number of Divisions | Number of divisions in the CPT log/fence report plot entities. This value controls the number of division lines visible in the plot entity, as well as the scale values at each division. |
Header Legend Type | Legend type displayed in the header of CPT log/Fence report plot entities. |