In Situ CBR
Supported Test Methods
Standard | Description |
|---|---|
ASTM D 4429-09 | CBR (California Bearing Ratio) of soils in place |
BS1377-9:1990:4.3 | Determination of the In Situ California Bearing Ratio (CBR) |
Input
IS-Comp Rel | CBR
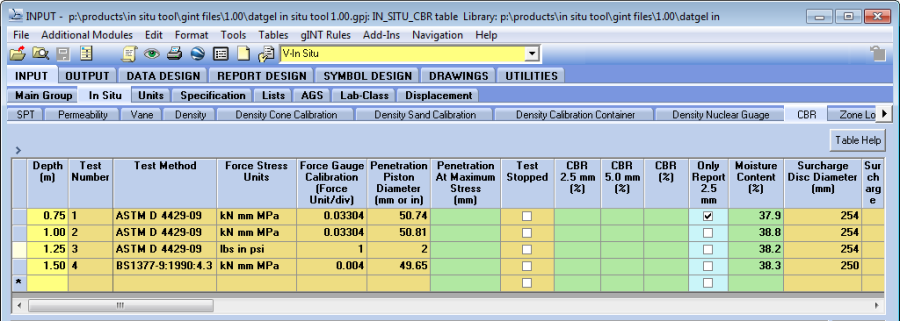
On the CBR (upper) table, enter the Depth that the test was undertaken at and the Test_Number and select the relevant Test_Method that the test is being performed in accordance with. Select the Force_Stress_Units and then record the Force_Gauge_Calibration_Force, the Penetration_Piston_Diameter, the Surcharge_Disc_Diameter and the Surcharge_Mass.
When you change row in the CBR (upper) table, change table or select save, the Surcharge_Pressure will be calculated. If a Moisture_Content has been recorded on the Lab Class | Moisture Content table for a Specimen_Number equal to ICBR and of a Depth equal to that of the CBR test, then the Moisture_Content field on the CBR (upper) table will be populated with this test value.
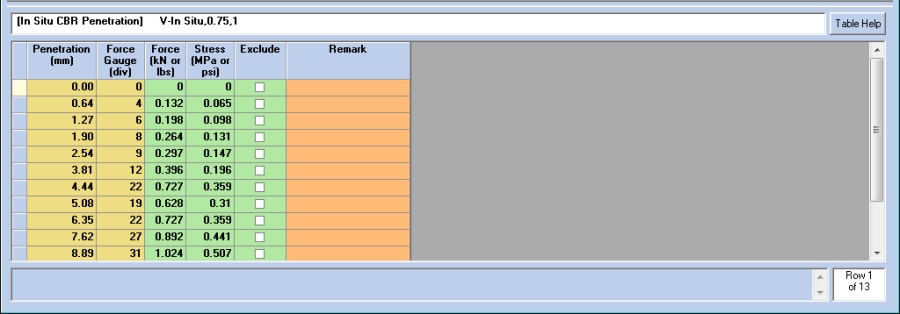
The Penetration and Force_Gauge readings should then be entered on the CBR (lower) table. A standard list of Penetration values will automatically populate the CBR (lower) table when you first move to it but these can be over-written if required. When you change row on the CBR (upper) table, change table or select save, the Force and Stress on the CBR (lower) table will be calculated.
CBR Plot and Calculations
To determine the Penetration_At_Maximum_Stress, CBR_2.0_mm, CBR_5.0_mm and CBR values, select Add-Ins > Datgel Lab Tool > In Situ CBR Graph to launch the CBR Graph.
The Penetration At Maximum Stress on the CBR (upper) table will only be calculated for the ASTM if the Penetration result on the CBR (lower) table is less than 5.08 mm
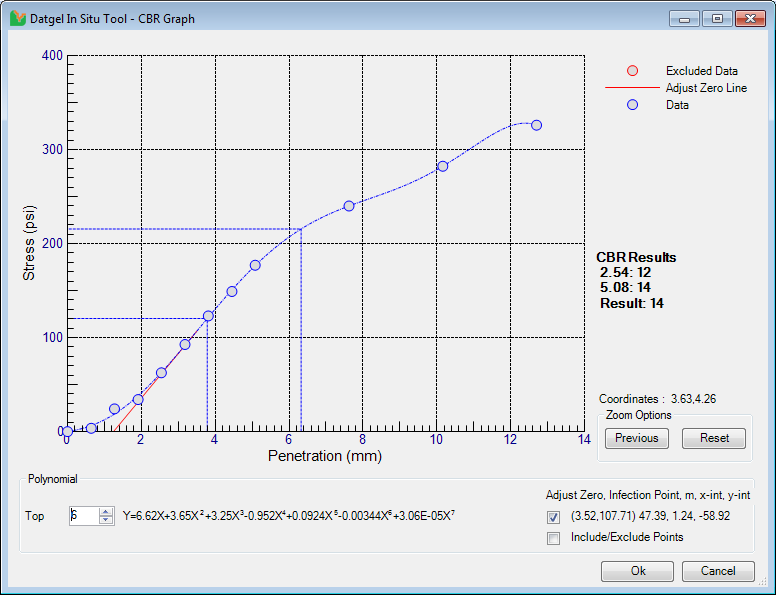
The initial graph displayed by the Datgel Lab Tool is based on the recorded test data in the CBR (lower) table and it can be manually refined should it be necessary.
To zoom in to an area of interest on the plot, you need to draw a window around the area that you wish to zoom into. To draw the window, move the mouse pointer to a position on the plot that you want to define as a corner of the zoom window and whilst holding the left mouse button down, move the mouse pointer to define the zoom window. When you release the left mouse button, the view will zoom into the area you have just defined.
To return to the previous view select the Previous button and to revert to the initial plot view select Reset. Or double click on the axis interval number to zoom to all data.
The polynomial order of the equation can be increased or decreased (to a minimum of 2) by clicking on the up or down arrow for the Polynomial Order box.
To correct for initial concave up data, check the Adjust Zero box. The X and Y coordinates of the Inflection Point, the m (gradient) and the Adjusted X, Y, and intercept values are displayed to the right of the check box.
Individual outlier data points can be excluded from the curve fit by checking the Include/Exclude Points box and then select the points on the graph that you wish to exclude. Once done, you can uncheck the box to re-enable the zoom functionality.
If you want to include previously excluded points, check the Include/Exclude Points box and then select then select the points on the graph that you want to include. Once done, you can uncheck the box to re-enable the zoom functionality.
The CBR Results are automatically displayed to the right hand side of the graph and are updated for any modifications that you make to the graph.
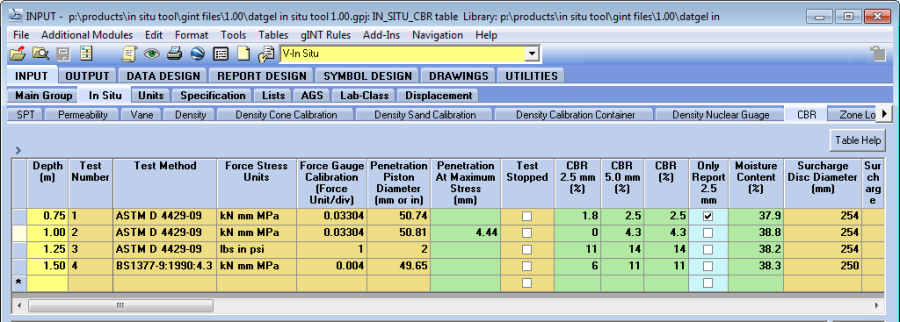
If you are satisfied with the CBR graph, click Ok and you will be returned to the gINT Input screen and if you observe the CBR (upper) table, you will see that CBR_2.5_mm, CBR_5.0_mm and the CBR value have been populated based on the CBR Graph.
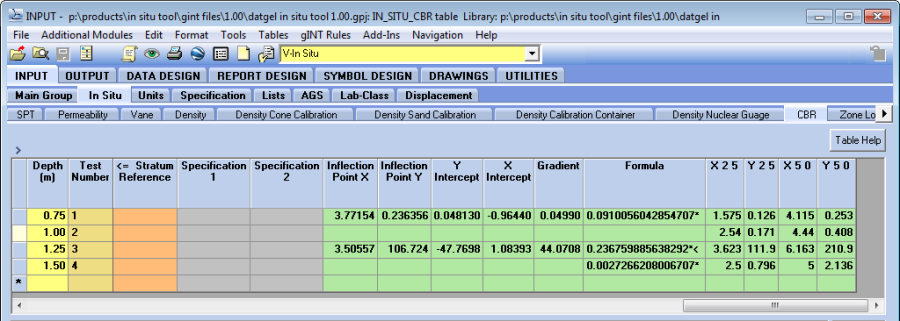
The calculated curve equation is displayed to the right of the selected polynomial order and the equation is written to the Formula field and the x and y co-ordinates for the CBR_2.5_mm and CBR_5.0_mm values are displayed in the X_2_5, Y_2_5, X_5_0 and Y_5_0 fields.
The Adjust Zero Line values are written back to the Inflection_Point_X, Inflection_Point_Y, Gradient, Y_Intercept, and X_Intercept fields. If the Adjust Zero box was unchecked, then these fields will be left empty.
If you are not satisfied with the defined compaction curve, click Cancel.
If the Only_Report_2.5_mm field is check, then the report will only display the CBR for 2.5 mm.
Output
- Graphs | IS CR CBR