Line Mapping Tutorial
Overview
This tutorial explains how to process defect data collected via a line map.
Data Entry
Processing a line map data set has three data entry steps.
Alignment
You have two options to create the alignment, a) draw it in site map, or b) type it on the Alignment table
Site Map Option
- Go to Site Map
- If you have one straight line:
Start a line entity, and enter the coordinates in the command line, click enter.
Then in the command line type @[Line length in metres]<[angle CCW from horizontal heading east], click OK.
- If you have a multi-point line draw a polyline anyway you can
- The use Site Map > Convert Open Polyline to Alignment
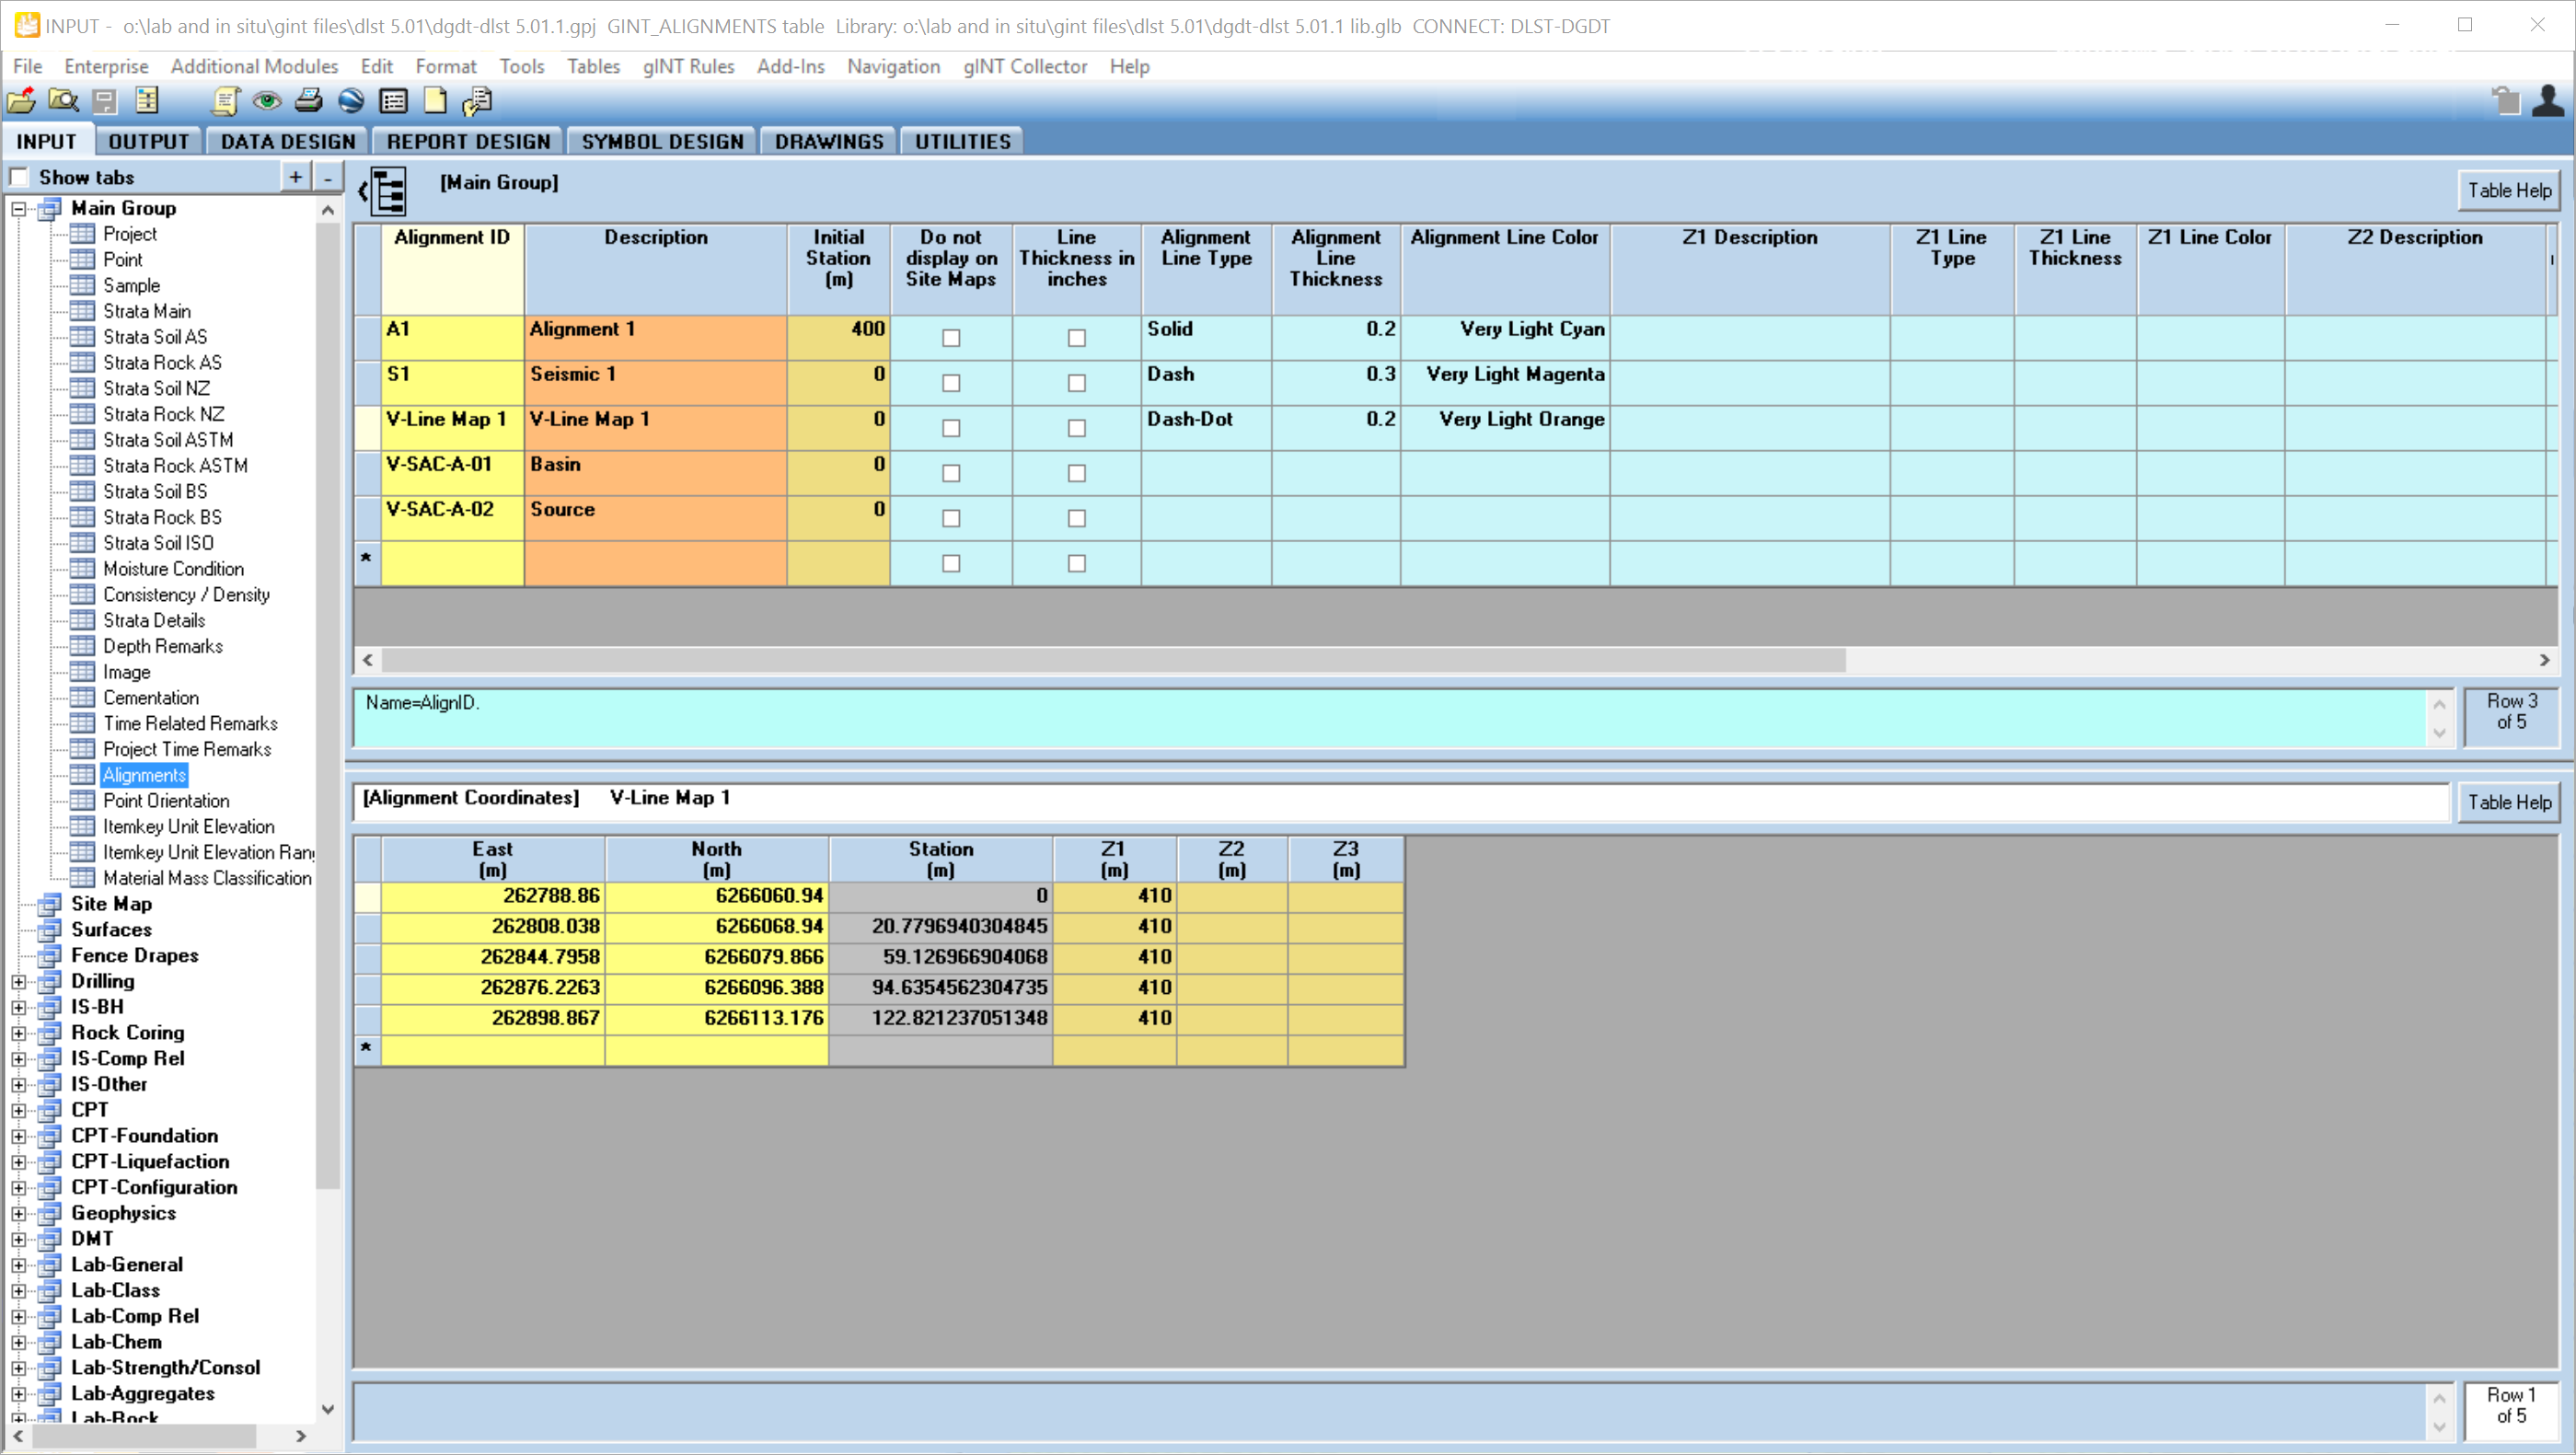
Type Alignment Option
Create a new Alignment_ID on the top half of the Alignment screen. Then enter the East and North on the bottom half of the screen. When the data saves the Station, aka Chainage, will calculate.
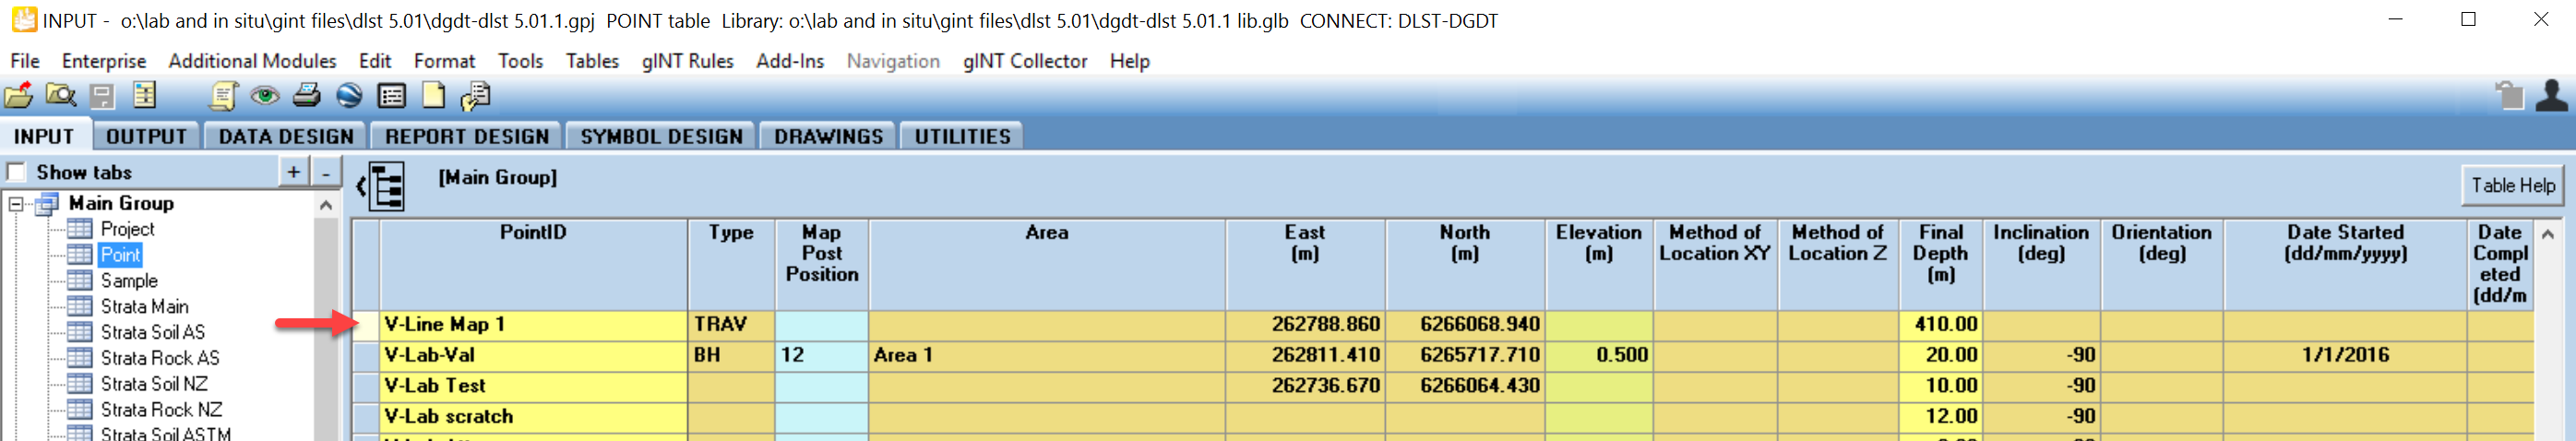
Point
Create one PointID on the POINT table for each line map, and enter data if fields:
- PointID
- Type = TRAV
- East and North of the start of the Traverse
- Final_Depth is the length of the line
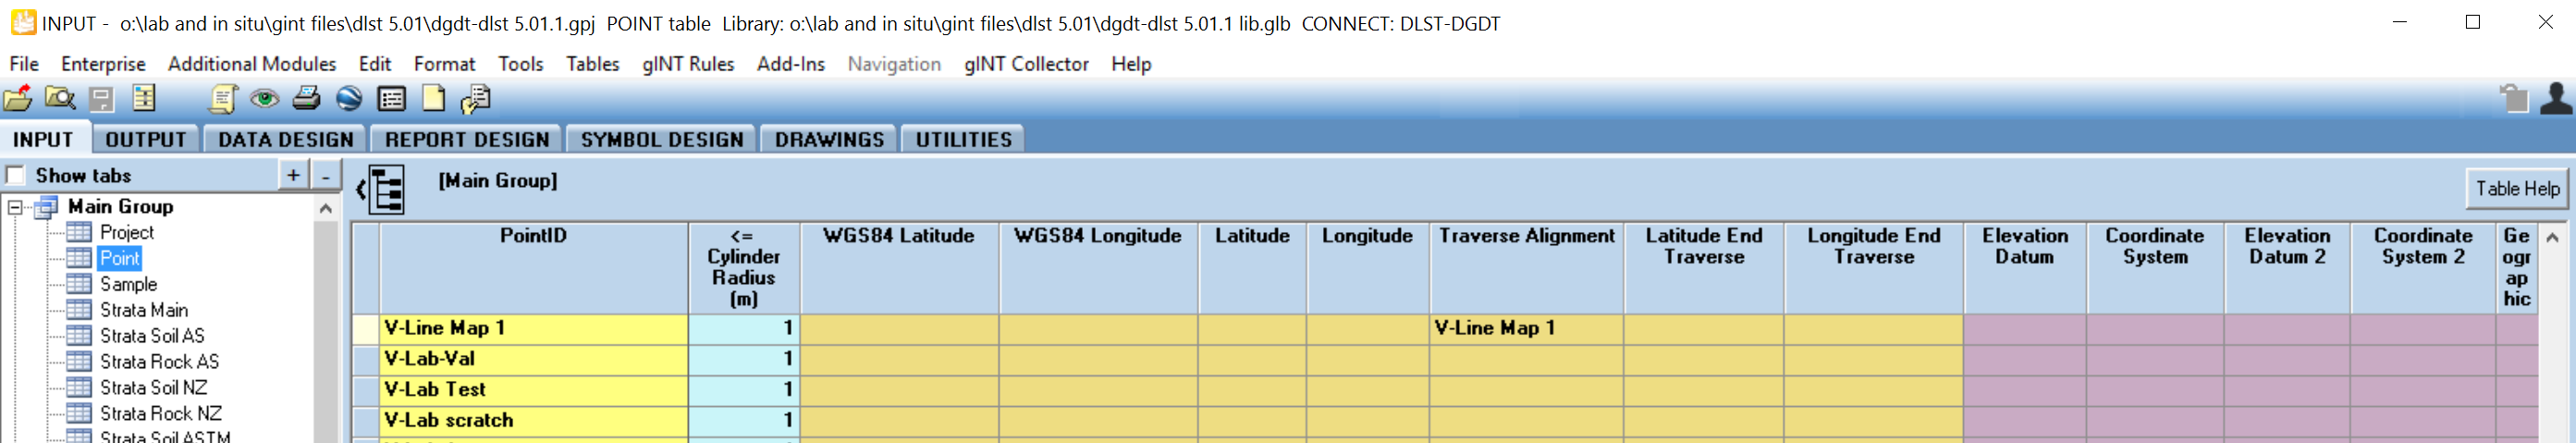
- Traverse_Alignment is the alignment you just created
Defect data
Now enter each defect on the Defects table.
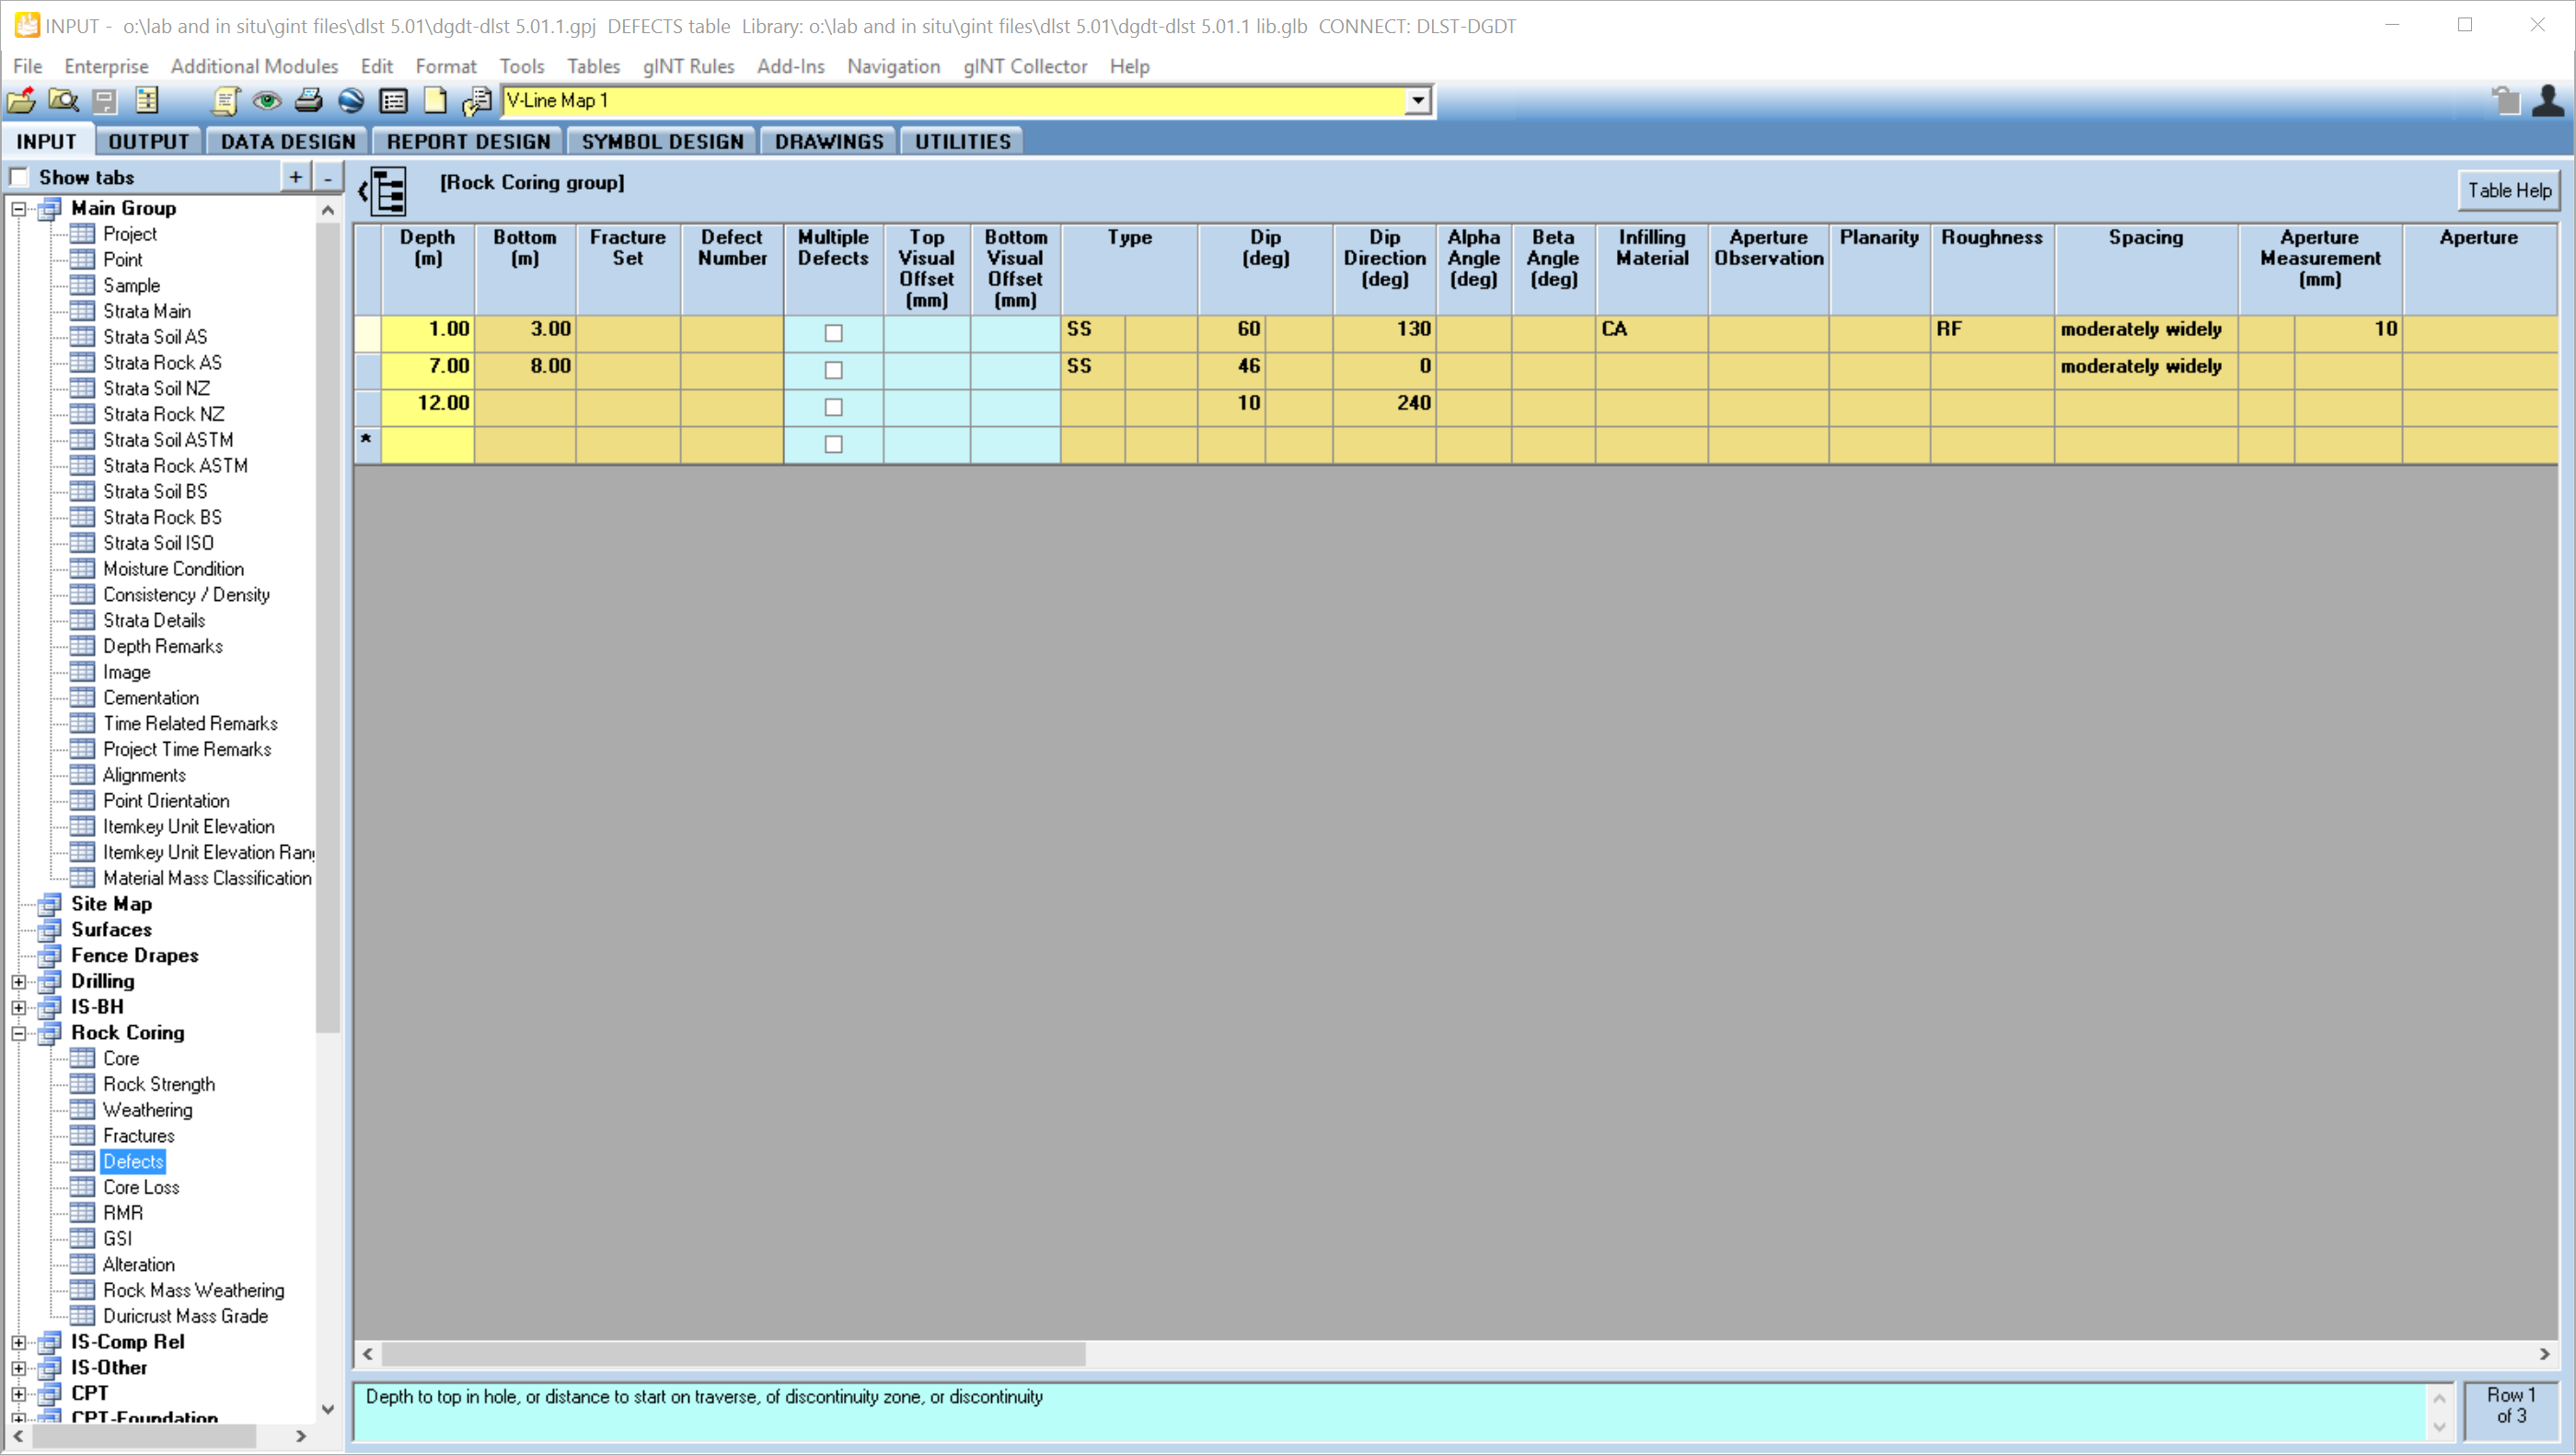
When the data saves the East and North fields will calculate.
Output
- Go to OUTPUT | Graphs.
- Select report A IS R DEFECT MAP A3P from the yellow object selector list.
- Check the box PointID list only
- Using the Pick list, select the Line Map PointID you just made in INPUT
- Preview, print or export the report. The report will automatically place the data in the middle of the page and pick a proper scale like 1:500. You can override this using the User Report Variables Min_E, Min_N and Scale.