Using the Output Tool
Overview
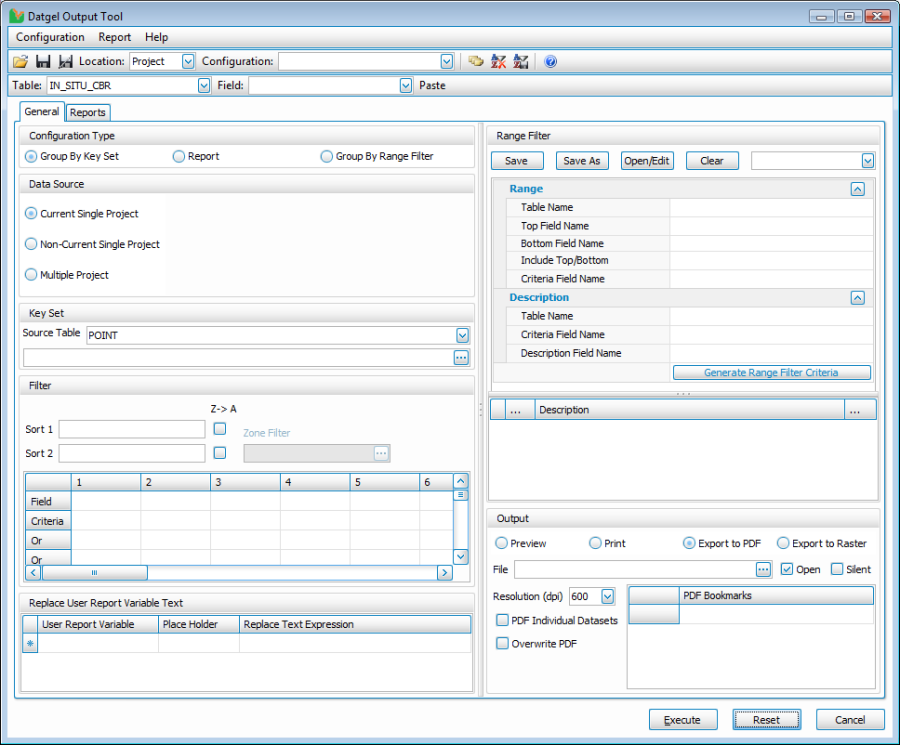
Select INPUT | Add-Ins > Datgel Output Tool > Datgel Output Tool to launch the tool.
The Tool has two tabs, General and Reports.
The general tab allows for configuration of global / general options, such as Configuration Type, Data Source, Key Set, Filter, Range Filter, Output options, and general user report variable settings.
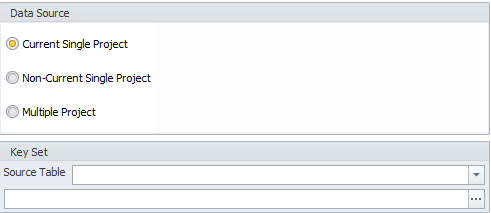
When using a *.gpj Project File, the Data Source will look as follows.
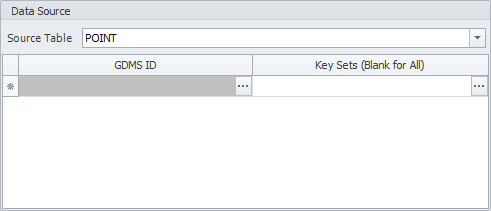
If you have connected to an Enterprise Database, the Data Source Selection will look as shown below.
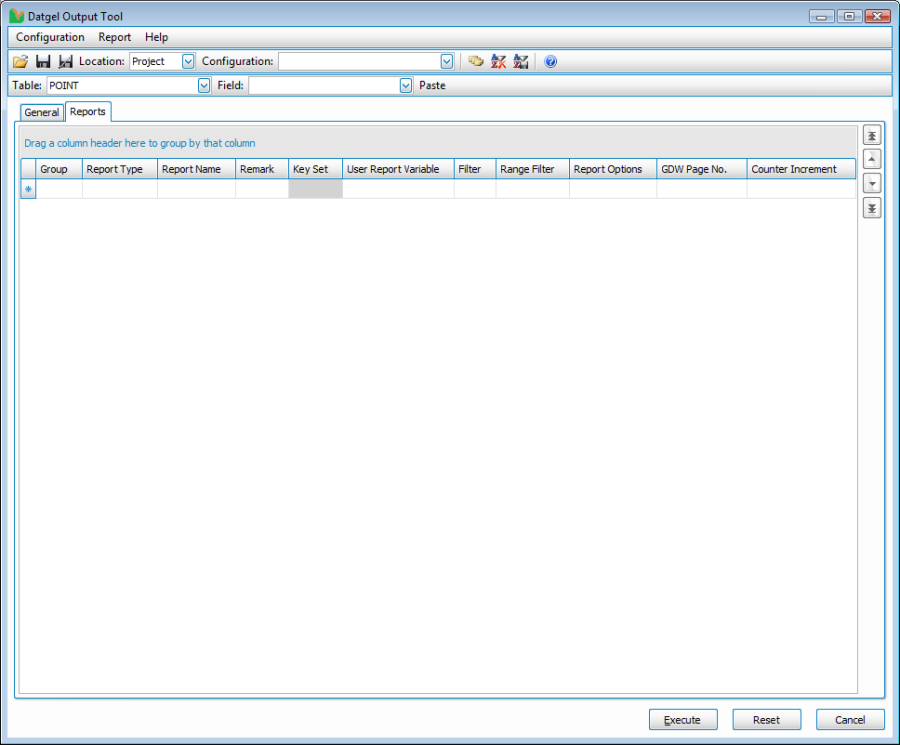
The Reports tab allows for the configuration of an unlimited number of reports, and optionally you may set report specific filters and other settings.
Menus and Toolbar
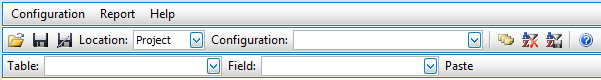
Configuration Menu
 Open/Edit Configuration (Ctrl+O): Initiates the Open Edit sub form, used to edit or delete existing configurations, and select an existing configuration
 Save Configuration (Ctrl+S): Save configuration
 Save Configuration As (F12): Save configuration as a new name, and define a description
- Configuration Location: The storage location of the current Configuration. You may open a Configuration then save it in a different location
- Settings Configuration: Combo box that allows you to select an existing name or type a new name
 Export Current Configuration to XML (Ctr+E): Export the current form configuration to an xml file; Enables simple interchange of configurations e.g. via email
 Import Configuration from XML (Ctrl+I): Import an xml file storing a configuration
 Set PDF Initial Folder (Ctrl+P): Set a default initial folder for the pdf and raster file browse. Stored on the current PC for the current user
Report Menu
 Populate All Reports (Ctrl+R): Clears the Reports grid and lists all reports in the current library
 Reports Grid - Clear Filter and Sort (Ctrl+F): Removes the user defined filter and sort from the Reports grid, and returns the Reports grid to the order that will be used for output
 Reports Grid – Save Current View (Ctrl+G): Sets the current reports Grid View as the default and it will now be used for Output. That is, the current sort and filter is permanently applied and any hidden rows will be deleted
 Update Reports Captions and Source Table (Ctrl+U): Initiates the configuration form for report captions and source table, and updates the list of reports
Help Menu
 Help (F1): Initiates the online help, and where applicable is context sensitive
- About Datgel Output Tool: Displays version and copyright information about the product
Data Tool
- Table: List of project tables
- Field: List of fields in select project table
Paste: Pastes select table and field to the Filter group in the format \[Table\].\[Field\]
Buttons
- Execute: Initiates the output run, Ctrl + Execute will display the gINT Script in a text reader and give you the option to save the file
- Reset: Clears the form and restores defaults
- Cancel: Closes the form
Configuration Type
The Configuration type defines how the output will be grouped. Three configurations exist:
- Group By Key Set: Outputs all rows in the Reports grid for each Key Set listed in the Key Set group on the General tab. A Key Set could be a PointID or Sample etc. Hence this option could be used to print many reports for BH1, then many reports for BH2 etc.
- Reports: Outputs all the Key Sets listed in the Key Set group on the General tab for each Report listed in the Reports tab. Hence this option steps through the Reports grid, and outputs the configuration defined on the current reports grid row, or if the field is empty then it uses the value on the General tab.
- Group By Range Filter: Outputs all the reports for each range filter checked in the General tab Range Filter group. Hence for the first checked range filter criteria, all reports will be output, then the second check range filter will have all reports output, etc.
Data Source
This section is applicable only when using *.gpj Projects. The UI shown below will be hidden when Enterprise is selected.
Three data source options are available:
- Current Single Project: The current project open in gINT INPUT
- Non-Current Single Project: Browse to open a different project to that currently open in gINT INPUT
- Multiple Project: Define multiple projects in a grid. The first project is used to define the table and field lists, and to store project level configurations
Key Set Group
The Key Set Group applies only when using *.gpj Projects. The UI shown below will be hidden when Enterprise is selected.
Select the Source Table that contains the Key Sets (e.g. POINT for the Hole ID list) by clicking on the ![]() button to display the list of available source tables.
button to display the list of available source tables.
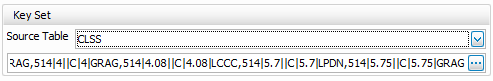
The Key Sets can then be selected by clicking on the ![]() button to display the Key Set Selector form.
button to display the Key Set Selector form.
Enterprise Data Source
If Enterprise was used within gINT and Output Tool is launched, this will provide the user with the following.
Select the Source Table that contains the Key Sets (e.g. POINT for the Hole ID list) by clicking on the ![]() button to display the list of available source tables.
button to display the list of available source tables.
Select the ![]() button on the grid's first column and row to choose a project. It will provide the user with the following dialog
button on the grid's first column and row to choose a project. It will provide the user with the following dialog
A row can be deleted by selecting the entire row using the * icon at the left side of the row and pressing the Delete button.
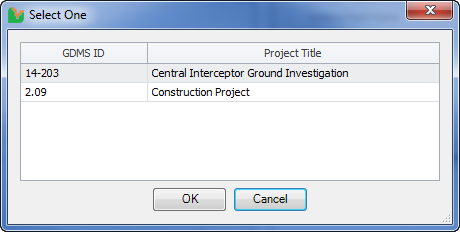
Select the row on the grid that contains the Key Sets to be used and click on the OK Button. Otherwise, click on cancel to stop the operation.
The Key Sets can then be selected by clicking on the ![]() button to display the Key Set Selector form.
button to display the Key Set Selector form.
Key Set Form
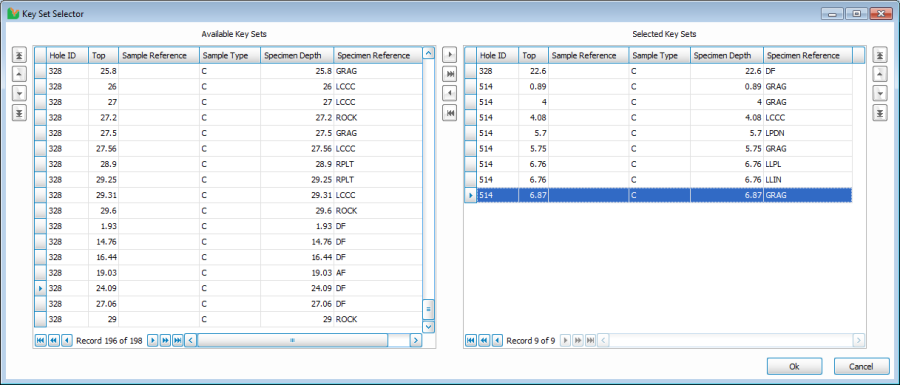
The Key Sets are then selected from the Available Key Sets grid and then by clicking on the ![]() button to select individual Key Sets or by clicking on the
button to select individual Key Sets or by clicking on the ![]() button to select all the Key Sets. The Selected Key Sets grid displays the chosen Key Sets.
button to select all the Key Sets. The Selected Key Sets grid displays the chosen Key Sets.
To remove a Key Set from the Selected Key Sets grid you can remove individual ones by clicking on that Key Set and then clicking on the ![]() button or you can remove them all by clicking on the
button or you can remove them all by clicking on the ![]() button.
button.
If the Configuration Type is set to Key Set, then you may reorder the Key Sets using the up and down arrows ![]() /
/ ![]() /
/ ![]() /
/ ![]() .
.
If a multiproject data source is selected, all keysets of projects can be found in this window. Otherwise, only the current project is used. In Enterprise Mode, the selected Project in the grid will be used to filter only the keysets that it contains.
Save and Open Configuration
User defined form configurations may be saved and recalled. Refer to section 2.2.1 Configuration Menu for a definition of each command and tool bar button.
Storage Location
Configurations may be stored in 5 locations, the first 4 are defined by the Location combo box in the toolbar, and XML is imported and exported via commands in the Configuration menu:
- Project: Stored in a project file and available to all users of that project file. The project file used is dependent on the data source:
- Current Single Project: The Configuration is stored in the current project file
- Non-Current Single Project: The Configuration is stored in the non-current project
- Multiple Project: The Configuration is stored in the first project listed in the multi project grid
- Library: Stored in the current library, and available to all users when using any project file
- Computer: Stored on the local computer, and available to all users of that computer
- User: Stored on the local computer, and available to only the current user
- XML: XML files storing configurations may be imported and exported via the Import Configuration from XML (Ctrl+I) and Export Current Configuration to XML (Ctr+E) commands. This allows for easy transfer of configurations via email
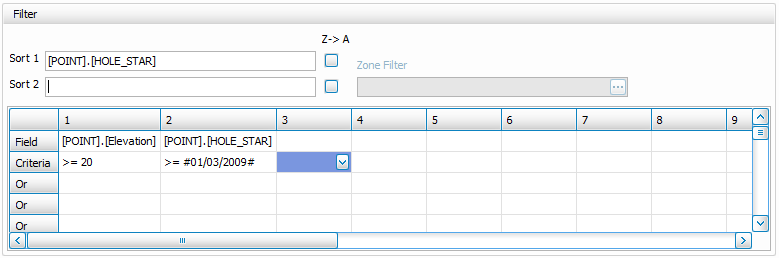
Filter Group
The Filter function works in a similar manner as the gINT OUTPUT Filter. The program automatically ensures a space is entered after the operator and before the value, and single quotes are placed around text and # around dates. (e.g. > 'A', Like 'BH', > #01/01/2009#).
Range Filter Group
The Filter function works in a similar manner as the gINT OUTPUT Range Filter with the exception that the tables/fields are selected from a drop-down list that has been automatically populated with a list of the table and field names in your project file, and the criteria range is picked from the populated list.
The generic range filter configuration in the vertical grid may be saved and recalled to/from the current library.
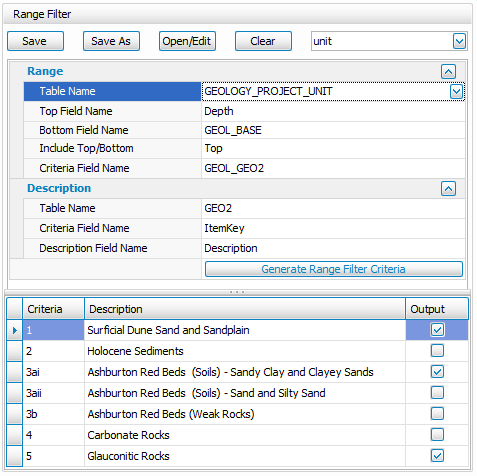
Range
- Table Name: Project table that stores the range data; Normally a PointID,Depth table holding Geotechnical Unit or Lithology data
- Top Field Name: Field in the Range Table that stores the top depth of the range; Normally Depth is set
- Bottom Field Name: Field in the Range Table that stores the bottom depth of the range
- Include Top/Bottom: Defines if Top, Bottom, Both, or Neither are to be included in the range. If left blank, Bottom is used; We recommend Top
- Criteria Field Name: Field in the Range Table that stores the criteria or code value
Description (Optional)
- Table Name: Project table that stores the description of the criteria. Normally an ItemKey table
- Criteria Field Name: Field in the Description Table that stores the Criteria or code; Typically ItemKey
- Description Field Name: Field in the Description Table that stores the Description
Other
- Generate Range Filter Criteria: Populates the grid with criteria based on the Range and Description tables and fields configuration
- Output Column: Check the criteria you wish to output
Range Filter Configuration
- Save: Save current range filter vertical grid configuration to the name listed name combo box
- Save As: Save the current range filter vertical grid configuration to a new name
- Open/Edit: Mange range filter configurations – change name, description and delete
- Clear: Clears the vertical grid and criteria grid, doesn't delete the saved configuration
- Name combo box: Select a configuration or type a new name
Steps to define a range filter
- Define Range items – Table Name, Top Field Name, Bottom Field Name, Include Top/Bottom, Criteria Field Name
- Optionally, define Description items – Table Name, Criteria Field Name, and Description Field Name
- Click Generate Range Filter Criteria
- Check the Output box for the Criteria you wish to output
Output Group
The Output function works in a similar manner as the gINT OUTPUT Export to File and Print options. Output option specific guidance is provided below:
- Preview and Print: No output tool settings apply. Note that gINT can associate a printer with each report using REPORT DESIGN | File > Set Printer for Reports…
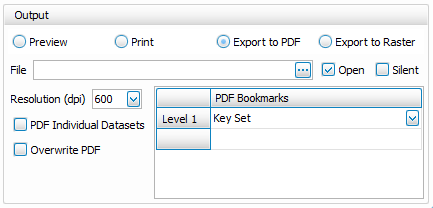
- Export to PDF:
- Resolution (dpi): This property allows you to specify the Resolution, in dots per inch (dpi), of the PDF file that you are creating with the PDF Export command
- PDF Individual Datasets: Exports a separate PDF file for each Key Set and Report Combination. Only applicable to Group by Key Set
- Overwrite PDF: If the PDF file exists then it will be overwritten
- Open: Open file after export
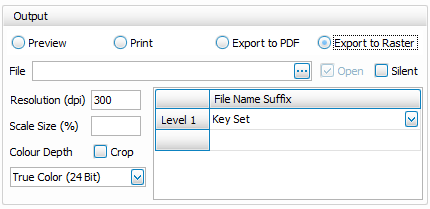
- Export to Raster:
- Resolution (dpi): Resolution of Raster image in dpi
- Scale size (%):This will stretch or compress the image as per the supplied value
- Crop: If marked, the image will be cropped upon export; Cropping will eliminate all white space around the image leaving just a one pixel wide white border
- Colour Depth: Don't pick True color just because you think it is better. Image file size goes up dramatically as you work down the above list. If you don't have color on your drawing, select Monochrome. If you just use the standard 32 colors that are shipped with gINT, the 16 color option will work. Only use the other options if you have created your own colors and are using them on the output or you are making use of the Scale size (%) option.
- General
- Silent: The error log form at the end of the output run will not display
PDF Bookmarks and Raster File Name Suffix
This group allows you to configure the PDF bookmark hierarchy or Raster File Name, with the option for an unlimited number of branches.
In the case of Raster Export, the file name defined in the File text box is used, followed by a concatenated list of items from the File Name Suffix grid separated by " – " .
For each branch you may pick from the following list, some options are Configuration Type specific:
- Key Set
- PointID
- ProjectID - PointID
- Report Name: Field on Report tab grid
- Report Caption: Defined by Output Tool > Reports > Update Reports Captions and Source Table command, see section 2.14 Update Reports Captions and Source Table
- Report Type: Field on Report tab grid
- Remark: Field on Report tab grid
- Group: Field on Report tab grid
- Group - Remark
- Report Name - Report Caption
- Report Type - Report Name
- Report Type - Report Caption
- Range Filter Criteria
- Range Filter Description
- Range Filter Criteria - Description
Replace User Report Variable Text
The Replace User Report Variable group allows you to globally configure User Report Variables, and define Place Holders that may be added to User Report Variables which at output time will be replaced by the Replace Text Expression.
The order of replacement of User Report Variables is:
- User Report Variable
- User Defined Place Holder
- System Place Holder
Hence, you may refer to System Place Holders in User Place Holder Replace Text Expressions, and refer to System Place Holders and User Place Holders within User Report Variable type replacers.
User Report Variable Replacers
The User Report Variable column has a lookup list containing System values (described in the following table), and all User Report Variables from all reports in the current library.
System User Report Variable Replacer | Description |
Auto Counter Start | Enter a number in Replace Text Expression. Overrides the auto counter for report rows, useful to start figure numbers at a number other than 1/a/A |
Initial Figure Number | Allows the user to set a global value for the Initial Figure Number text box in the top right of the gINT OUTPUT Screen. |
The value for a User Report Variables listed in the Replace User Report Variable grid is replaced with the Replace Text Expression.
The User Report Variable field on the Reports tab must be populated with the gINT script syntax text in order for this to work.
Place Holders
You may enter special text strings into User report Variables that will be replaced when you click Execute. System Place Holders allow for incrementing of figure or page numbers. User Defined Place Holders could be used to append a string on the end of an existing User Report Variable Value, set a drawn by name or drawn date etc.
- Place holders are case sensitive
- Replace text expressions that contain a comma must be surrounded in double quotes, e.g.:
"<<ListBuildSepTrim( - ,\[\[Group\]\], \[\[Report Type\]\], \[\[Report Name\]\], \[\[Caption\]\], \[\[Remark\]\], \[\[Key Set\]\], \[\[GDW Page No.\]\])>>"
System Place Holders
The following place holder within User Report Variables will be replaced when the user clicks Execute during the script generation.
Place Holder | Description |
[[Auto Counter 1]] | Report grid item number, 1 based |
[[Auto Counter A LC]] | Similar to above, except this will return lower case letters. |
[[Auto Counter A UC]] | Report grid item number converted to an upper case letter, 1 based. Will return A to ZZ, e.g. 30th report grid row will return AD. |
[[Caption]] | Reports grid column |
[[Counter Increment]] | Reports grid column |
[[Current URV.<URV Name>]] | Current user report variable value in the reports grid field for <URV Name> Name, or the value set in a preceding row in the Replace User report Variable grid |
[[Current URV]] | Current user report variable value in the reports grid field for current Name, or the value set in a preceding row in the Replace User report Variable grid |
| [[GDW Page No.]] | Reports grid column |
[[Group]] | Reports grid column |
[[Key Set]] | Reports grid column |
[[Range Filter Criteria]] | Current range filter criteria code, only applicable to Group by Range Filter |
[[Range Filter Description]] | Current range filter description, only applicable to Group by Range Filter |
[[Remark]] | Reports grid column |
[[Report Name]] | Reports grid column |
[[Report Type]] | Reports grid column |
User Defined Place Holders
You can define custom place holders to replace text in User Report Variable rows. The place holder may be surrounded by text within a row.
Example Usage
This example does the following:
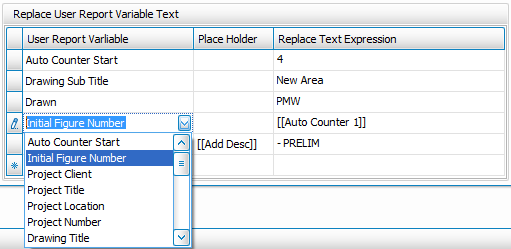
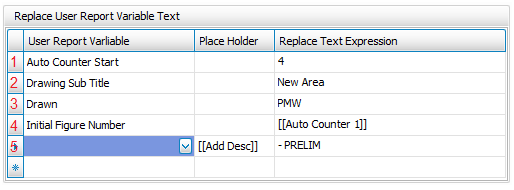
- Sets the Auto Counter Start to 4, so the first figure number will be Figure 4
- For all reports listed in the Reports tab, the value for User Report Variable named Drawing Sub Title will set to New Area
- For all reports listed in the Reports tab, the value for User Report Variable named Drawn will set to PMW
- Sets the Initial Figure Number for each report to the Auto Count Incrementing Number
Replaces sub-strings _\[\[Add Desc\]\]_ within the User Report Variable for all reports with the string _– PRELIM
After setting the configuration in the Replace User Report Variable Text group, move to the Reports tab and for all reports in the grid do the following:
- Click on the User Report Variable edit button for a row
Place the text \[\[Add Desc\]\] at the end of the Drawing Title value, highlighted in the red box. Note how there is no space before \[\[, this allows you to set the Place holder to "" if desired and no empty spaces will be applied
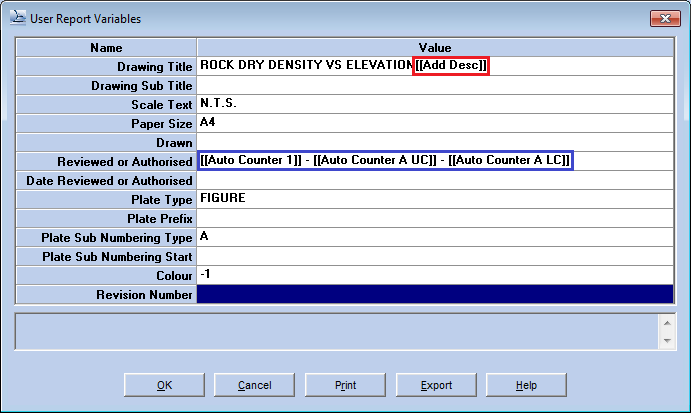
Note the System Place Holders highlighted in the blue box- Click OK
- Apply the place holder to other reports
Example Usage of Current URV
Replace User Report Variable Text grid
User Report Variable: Drawing Title

Replace Text Expression:
[[Current URV.Scale Text]], [[Current URV.Drawing Title]], ][Current URV]], WHOLE SITE"
Example Output
AS SHOWN, BULK DENSITY VS ELEVATION, BULK DENSITY VS ELEVATION, WHOLE SITE
Reports
The Output Tool utilises any reports that exist within your gINT library file. Settings defined on the Reports tab take precedence over General tab settings.
Refer to section Report Menu for a definition of each command and tool bar button.
The Report grid columns are:
- Group: A meta data field, can be used as a PDF bookmark or in Replace Text Expression
- Report Type: gINT report Type, e.g. Log
- Report Name: gINT report name, e.g. Non-Cored Borehole
- Remark: A meta data field, can be used as a PDF bookmark or in Replace Text Expression
- Key Set: Combination of key fields, e.g. PointID, or PointID,Depth. The source table for the current report is defined by Output Tool > Reports > Update Reports Captions and Source Table command (see section 2.14 Update Reports Captions and Source Table), or in the source table on the General tab is used as a default.
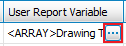
- User Report Variable: Clicking on the
 will display the native gINT User Report Variable form. You can set the values as required, including the use of Place Holders.
 - Filter: Clicking on the will display the Filter form, configure as required and click OK. The Filter function works in a similar manner as the gINT OUTPUT Filter. The code ensures a space is entered after the operator and before the value with single quotes placed around text and # around dates. (e.g. > 'A', Like 'BH', > #01/01/2009#).
- Range Filter: Clicking on the will display the Range Filter form, configure as required and click OK. See section 2.10 Range Filter for an explanation.
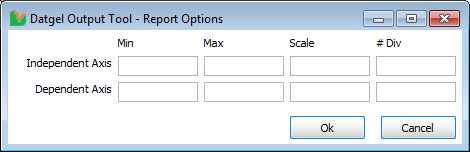
- Report Options: Clicking on the will display the Report Options form, configure as required and click OK. This is applicable to graphs only; other report types will have this field read-only.
- GDW Page No.: Setting the same value for two or more rows in the reports grid will initiate those rows to export to the same named GDW page, and then print/preview/export as configured. For example, if you have a direct shear graph report sheet that requires the presentation of 3 graph frames on one sheet then set the three graph report's GDW Page No. to Direct Shear Comp. If you have a different multi frame sheet in the same reports grid, then use GDW Page No. Direct Shear Comp A etc.
- Counter Increment: Defines the increment for Auto Counter System Place Holders. Normally you would leave this column blank and use the default "1", but when you have a report that will output multiple pages you would enter the number of pages here, e.g. "3". Seeing the Output Tool doesn't know how many pages the report will print, you need to manually type in the value.
- Add Spec: Define additional gINT script specification section lines. This text will be added below the last line of the Datgel Output Tool generated text.
Report grid rows can be reordered by using the arrow controls ![]() /
/ ![]() /
/ ![]() /
/ ![]() and individual reports can be removed from the grid by selecting the applicable row in the Reports tab grid and by pressing the delete key on your keyboard.
and individual reports can be removed from the grid by selecting the applicable row in the Reports tab grid and by pressing the delete key on your keyboard.
Prior to reordering, inserting a row or copy-pasting you will be prompted to either Save the Current View, or to Cancel and return to the Report grid.
Right click in the grid to Insert a Row or Delete the selected rows.
It is recommended Reports, Source Table, and Caption be defined by Output Tool > Reports > Update Reports Captions and Source Table command (see section 2.14 Update Reports Captions and Source Table). The Tool will function without this configuration.
Update Reports Captions and Source Table
For the Output Tool to function optimally, you should configure the Caption, Source Table, and Separate Sets for each report using the Output Tool > Reports > Update Reports Captions and Source Table command.
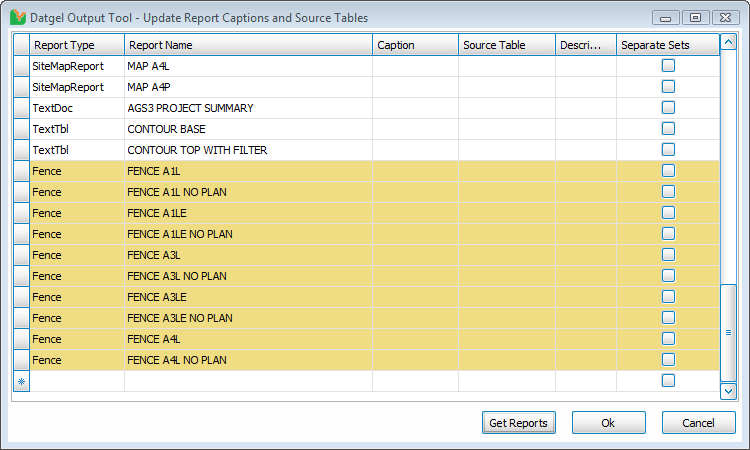
Upon loading the form you will be ask if new reports should be added. A message box will display indicating the number of new reports added, if any. Further, the new records will append at the end of the grid and be highlighted in a Pastel Beige colour.
You should now configure the Caption, Source Table and Separate Sets columns. Refer to the following for a definition. Click OK to save your changes.
Columns
- Report Type: List of report types
- Report Name: List of reports in library
- Caption: An option for PDF bookmark, raster file name and Replace Text Expression
- Source Table: Name of the table to be used by the Key Set Selector on the Output Tool Reports tab. For example, for logs you should set POINT, for a lab report you may choose CLSS or SPECIMEN. If you leave this blank, then the Source Table defined on the Output Tool General Tab will be used by the Key Set Selector form
- Description: Meta data field for a report description, not used in any function of the tool.
- Separate Sets: Will cause the generation of a unique script per keyset, only applicable to Group by Reports