Quick Start Guide
Overview
This page guides you through the setup and explains basic use of the Monitoring Tool.
gINT Professional or Professional Plus must be installed and licensed on your computer to use the Monitoring Tool.
Datgel Monitoring Tool Installation and Licensing
The Monitoring Tool package download from datgel.com
- Full version: https://www.datgel.com/customer/downloadableproducts
- Trial version: https://www.datgel.com/trial-software
Package Content
The Download .zip folder contains all you need to install and evaluate the Datgel Monitoring Tool. The content is:
- Documentation folder includes:
- Example reports
- EULA
- Links to the product and licensing online user guides
- Link to email to support.
- gINT Files folder includes:
- "datgel monitoring tool X.XX.X lib trial.glb" or "datgel monitoring tool X.XX.X lib.glb" (gINT library file)
- "datgel monitoring tool X.XX.X.gpj" (gINT project file)
- "datgel monitoring tool X.XX.X.gdt" (gINT data template)
- "mon hydrograph a4l and precipitation" (script to print a graph)
- Excel file and correspondence files for import and export from the excel file (.gci and .gcx)
- Installation files folder includes:
- Datgel Monitoring Tool installer.
Unzip and copy the content of the folder to your local computer.
Installation
Before Installation
A few basic preparations can help ensure an effortless installation.
- Make sure that the computer where you plan to install the program meets the minimum hardware and software requirements.
- Connect your PC to Internet before installation (the process may need a working Internet connection).
The Monitoring Tool requires that the Microsoft .NET 4.8 framework is installed on the PC prior to the installation of the Tool. If your PC does not have this, then it will be automatically downloaded and installed during the Tool installation process.
- Log into the PC with Administrator privileges before starting installation.
- It is recommended that you exit out of other applications that maybe running on your PC.
- Close gINT before you start installation.
Install DLL Program
- Extract the ZIP download, and Browse to the folder \Installation Files
- Double click the file named DatgelMonitoringTool-#.#.#.#.exe.
- Click Run to begin installation. Follow on the screen instructions when installation begins:
- Click Next on the Welcome to the Datgel Monitoring Tool Setup dialog
- Scroll and carefully read the License Agreement, and choose option I Agree, and click Next.
Alternatively choose I Do Not Agree and click Cancel if you disagree with the license agreement. The installation will stop and exit. - On the Select Installation Folder dialog, either accept the default folder (recommended) or select Browse to specify the folder where you want to install the Monitoring Tool Add-In.
Leave Everyone bulleted to indicate that anyone logged onto the PC can use the Monitoring Tool Add-In.
Click Next when ready.
OPTIONAL Click on Disk Cost to view the disk space statistics. Click OK when done - Click Next to start installation.
- Observe the progress bar to monitor installation progress
- Click Close when the Installation Complete dialog is displayed.
Open gINT
- Start gINT
- When you open gINT if it asked for a library, then browse to the downloaded unzipped folder and select the library file (.glb). Otherwise after gINT opens select File > Change Library, and browse to the aforementioned library. Note: the library is locked for the Trial version.
- Select File > Open Project. Browse to the downloaded .zip folder and select the project file (.gpj)
License Activation
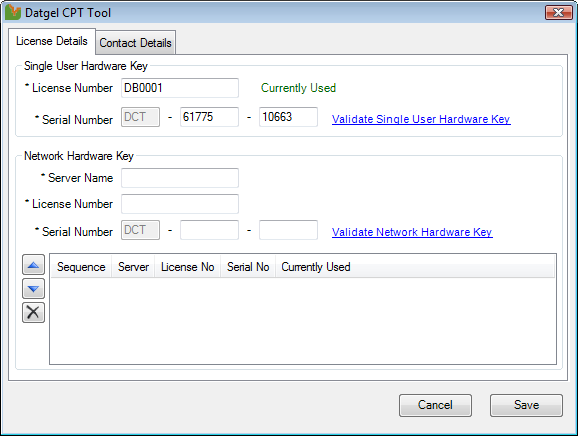
Once the installation of the Monitoring Tool is completed, you need to activate the license. The steps to follow are different and depend on if you are testing a Trial version or a Full Licensed version.
Using the tool
Review existing example data
The gINT files included in the package contain example data that covers all type of calculations included in the Tool.
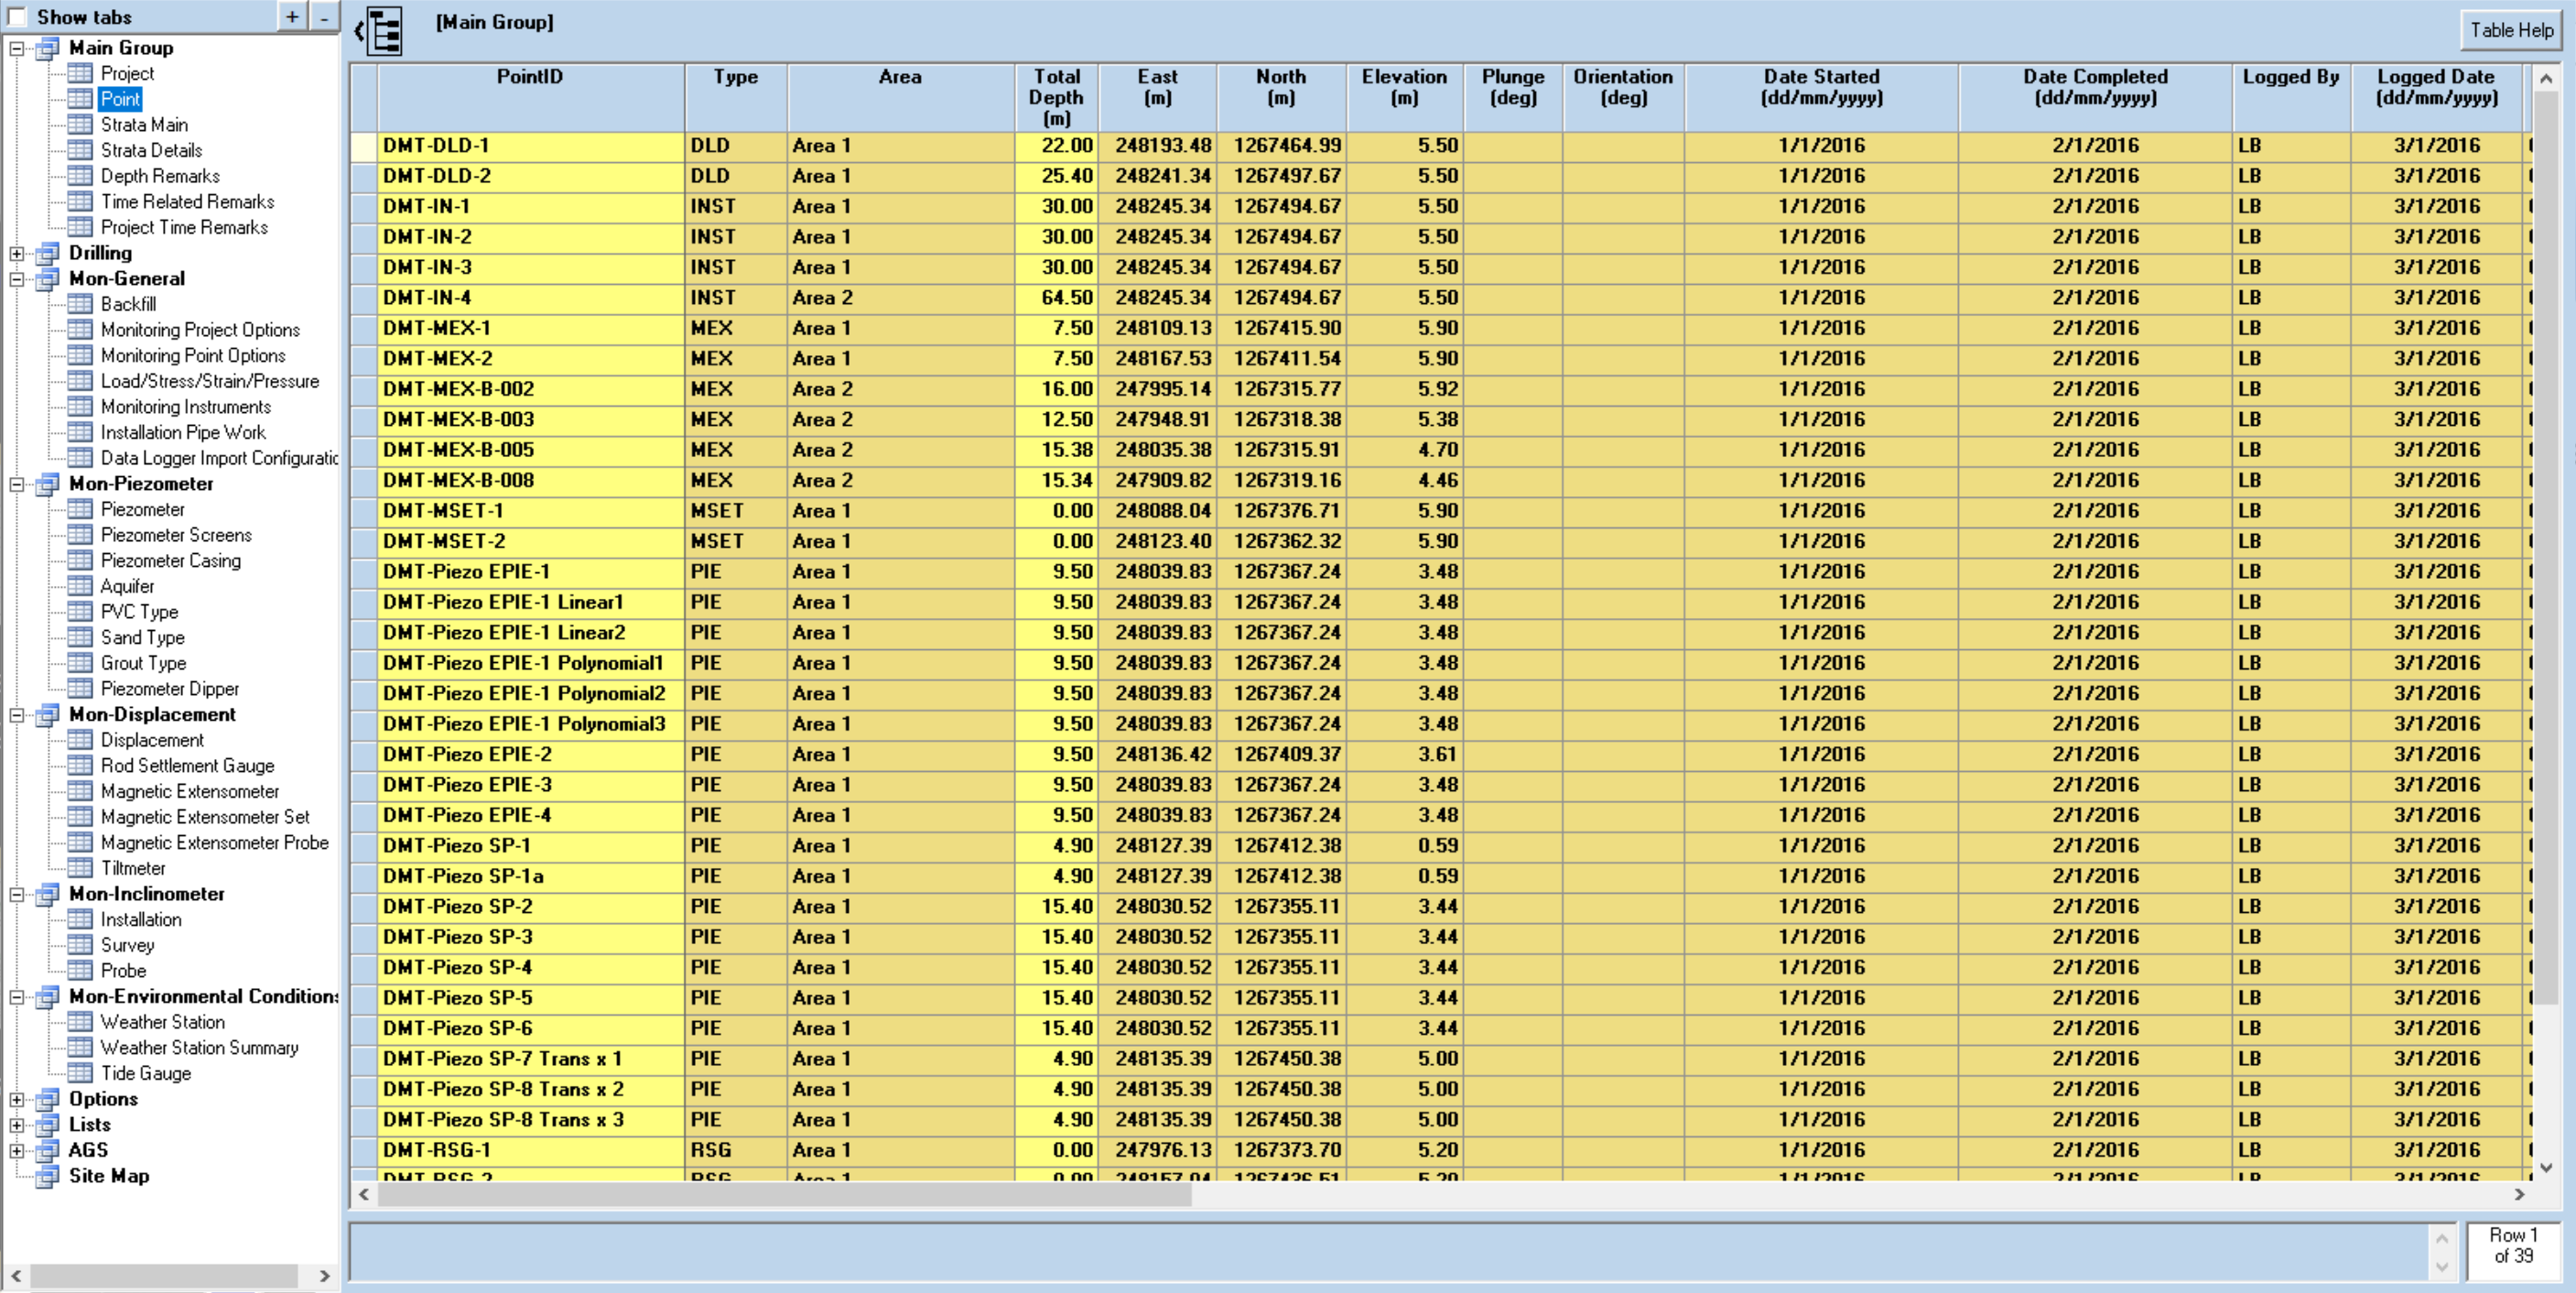
Main Group | Point table stores the general information related to the Borehole (Hole depth, coordinates, elevation, etc). Each row is a borehole.
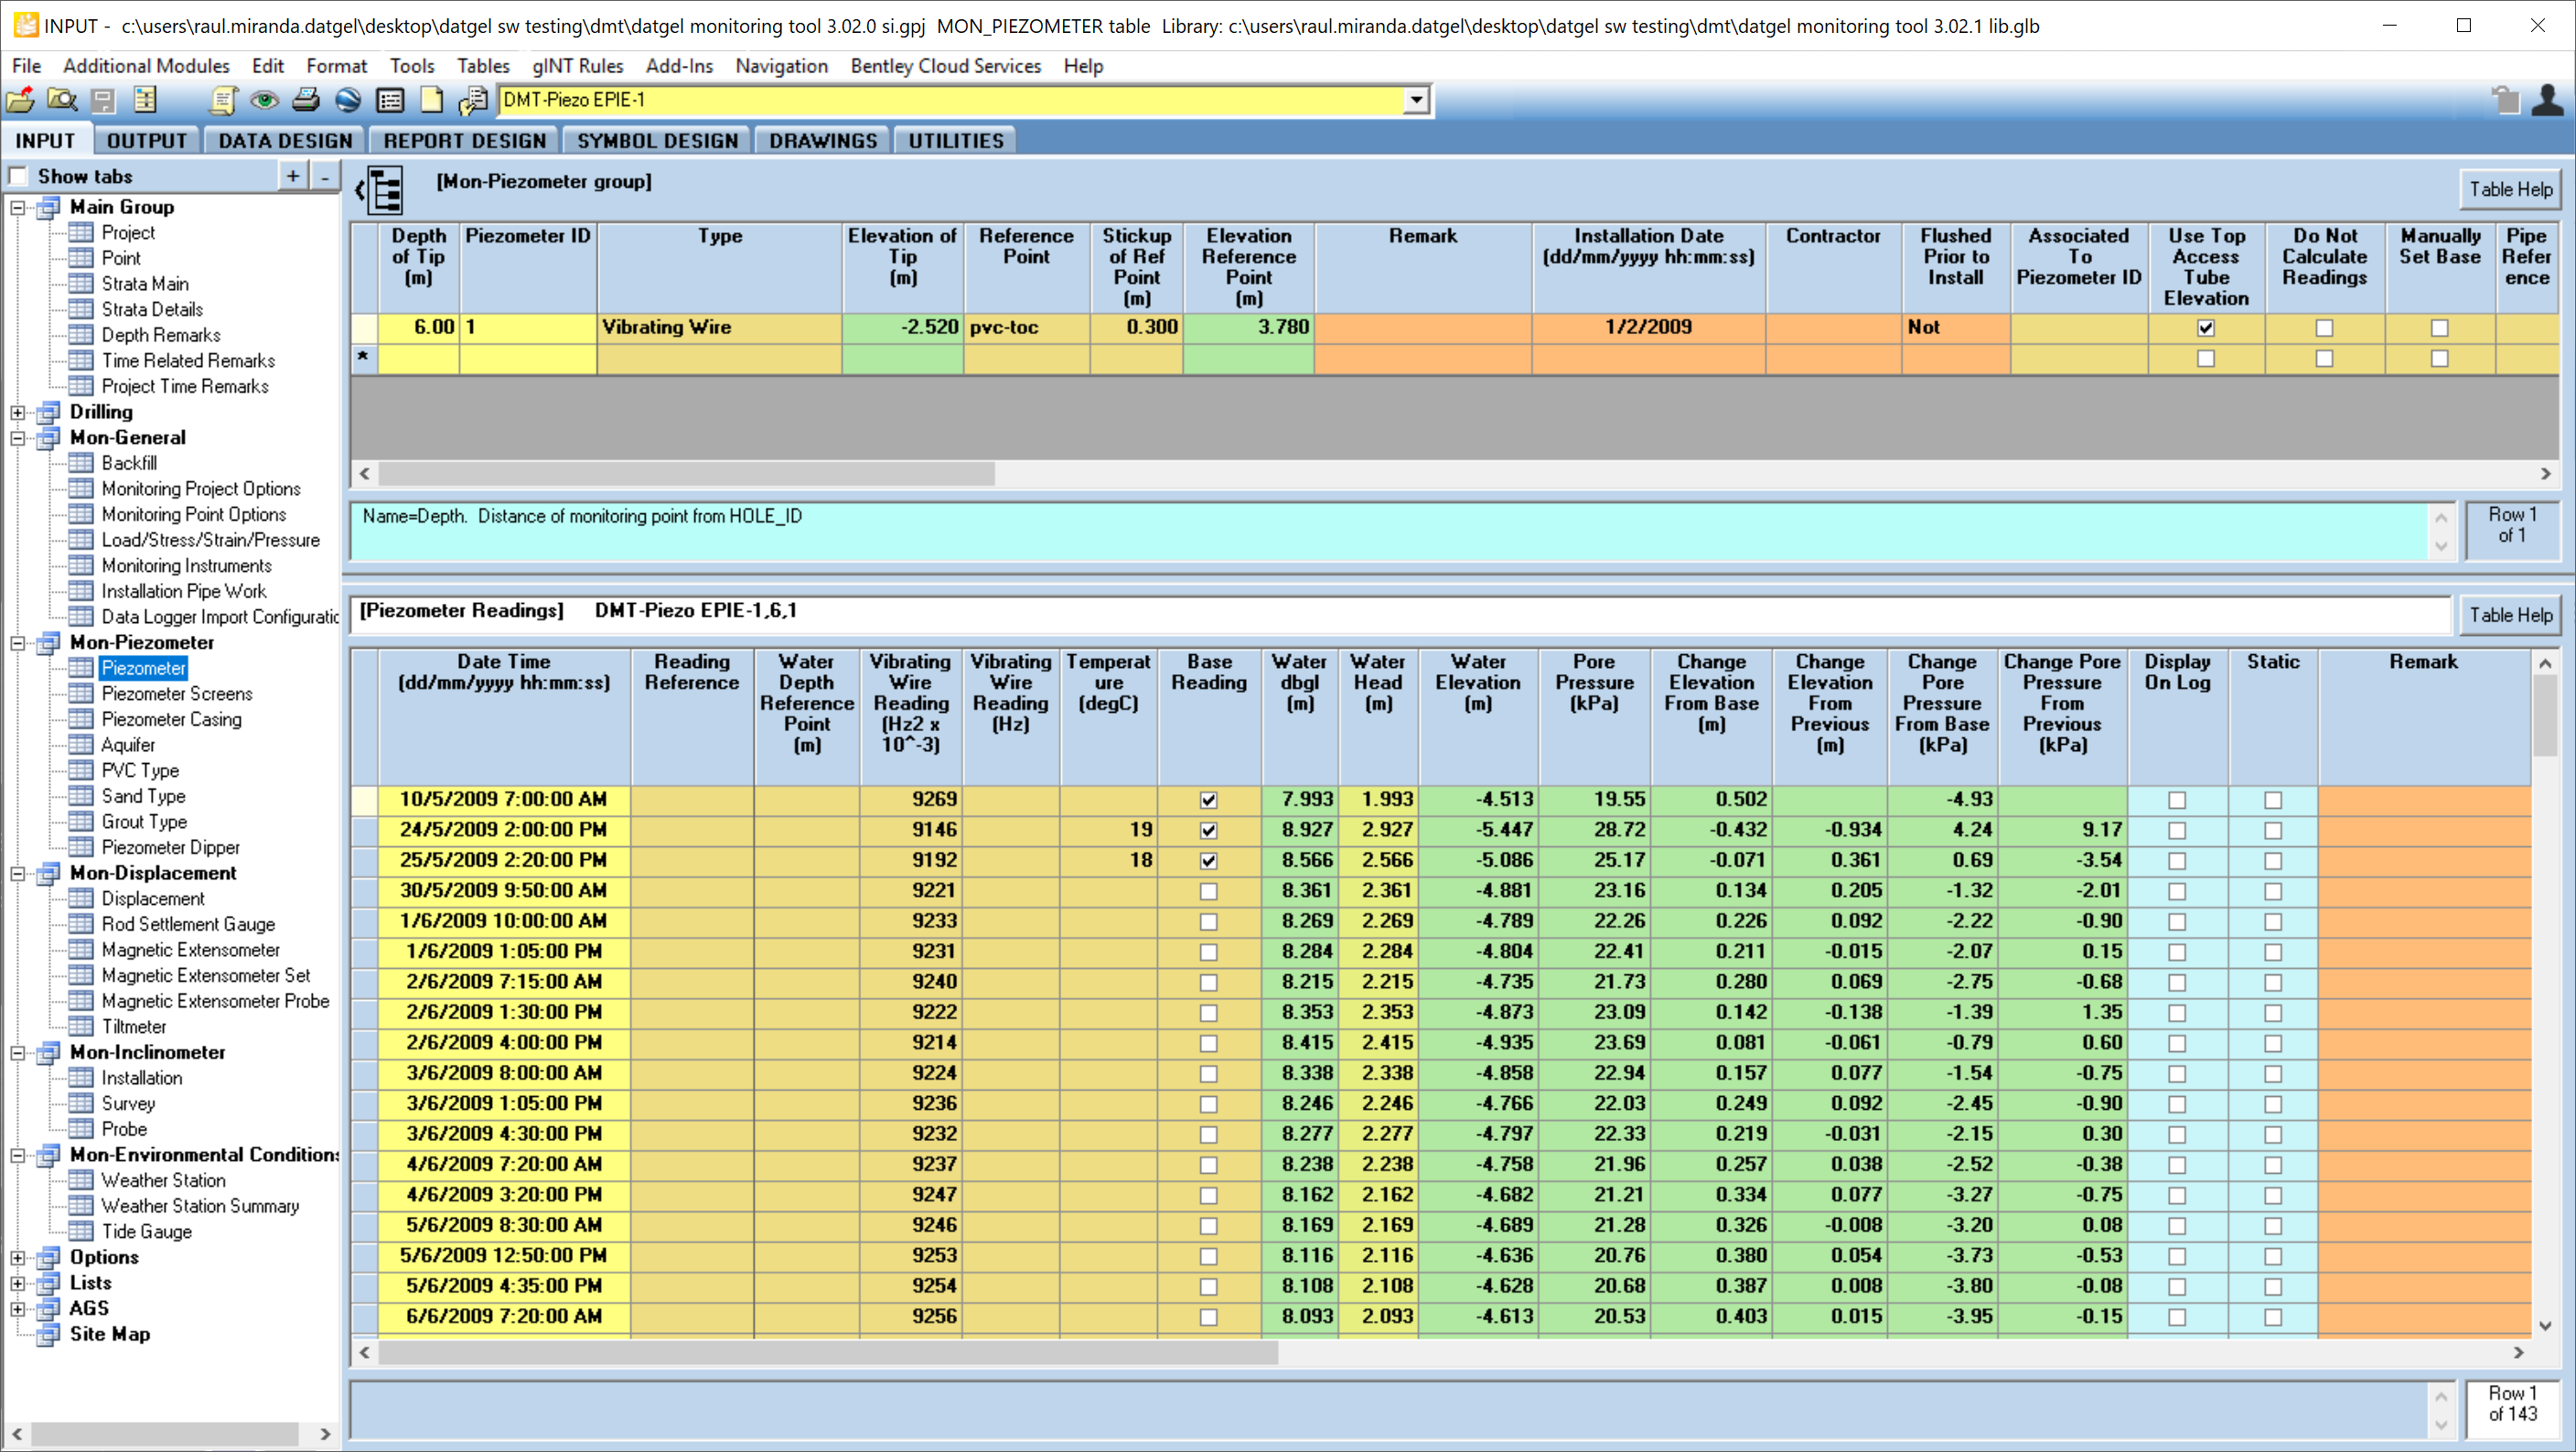
Monitoring data is stored in the Groups: Mon-Piezometer, Mon-Displacement, Mon-Inclinometer and Mon-Environmental Conditions.
You may review the example data, what fields are needed for each calculation and which results are calculated. To see the calculations, you need to delete values on the green cells (calculated field) and click Save or Ctrl+S. The results will be written to the green cells again.
Output a Report
The Monitoring Tool library contains logs and graph reports.
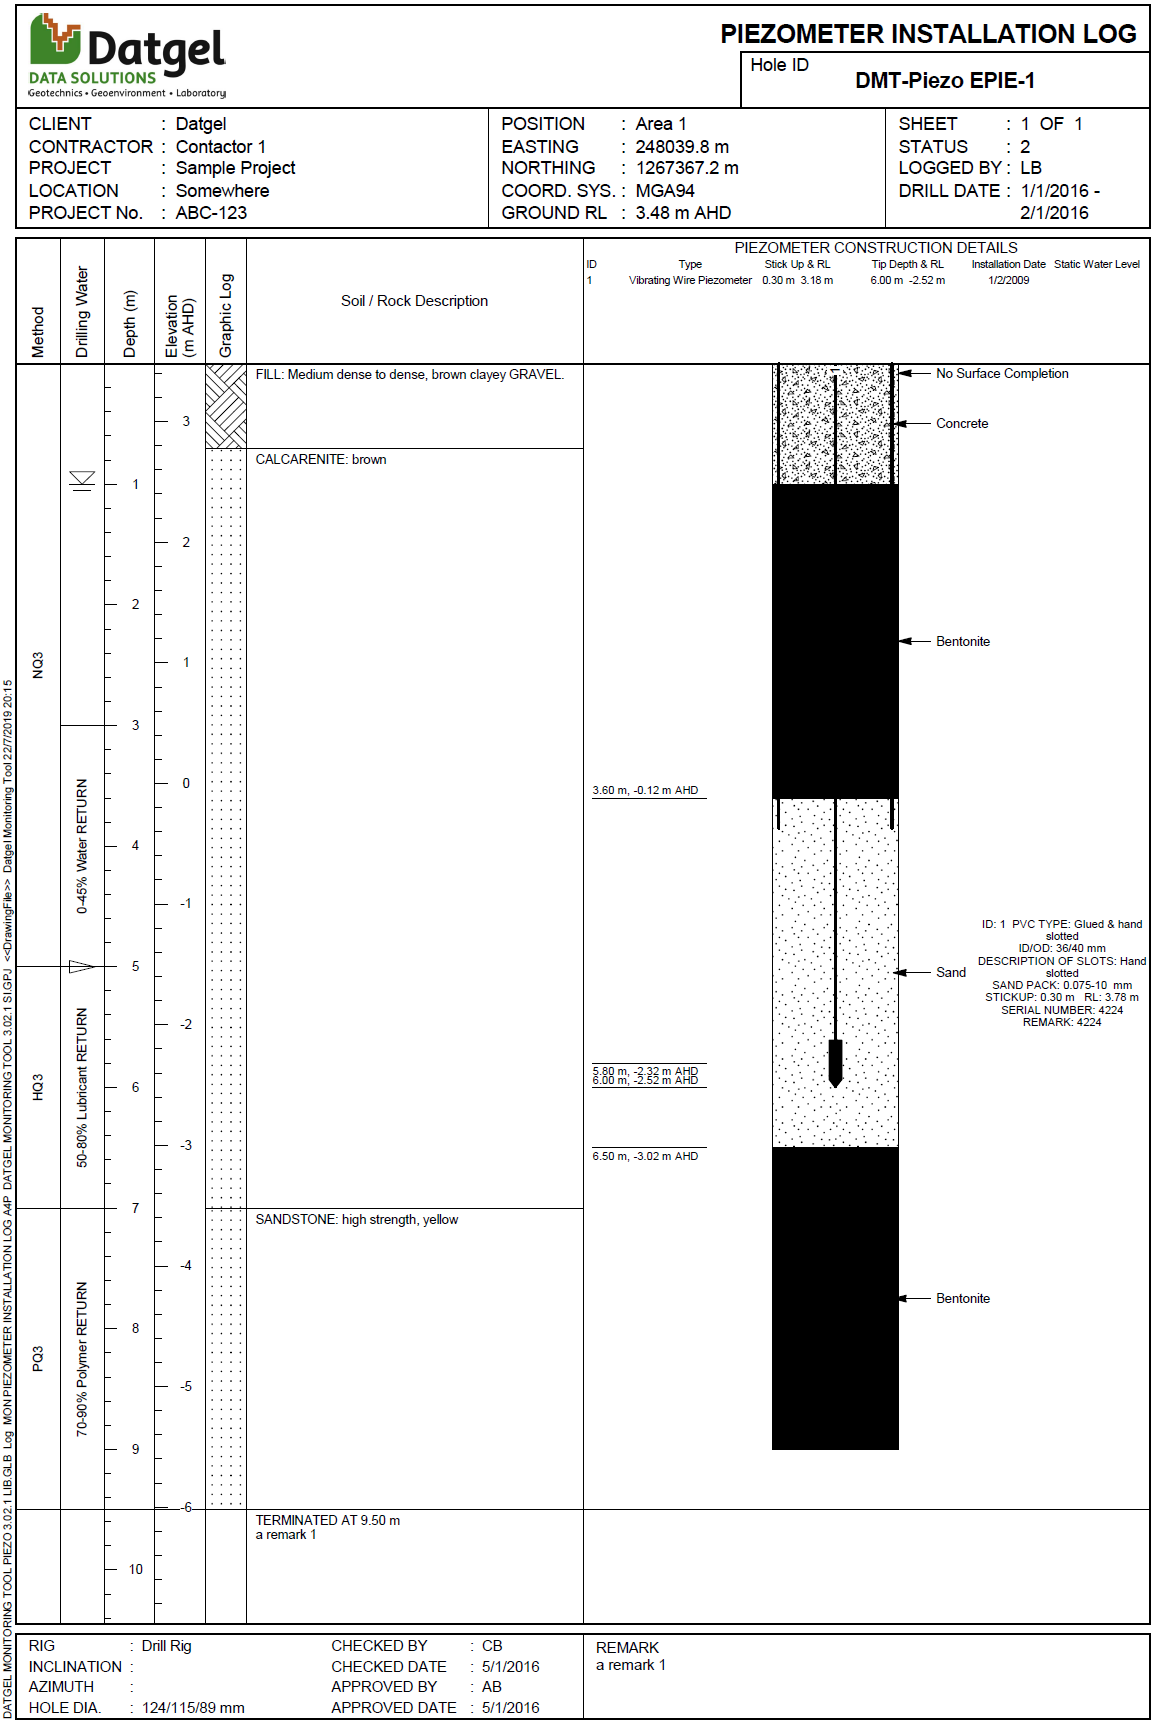
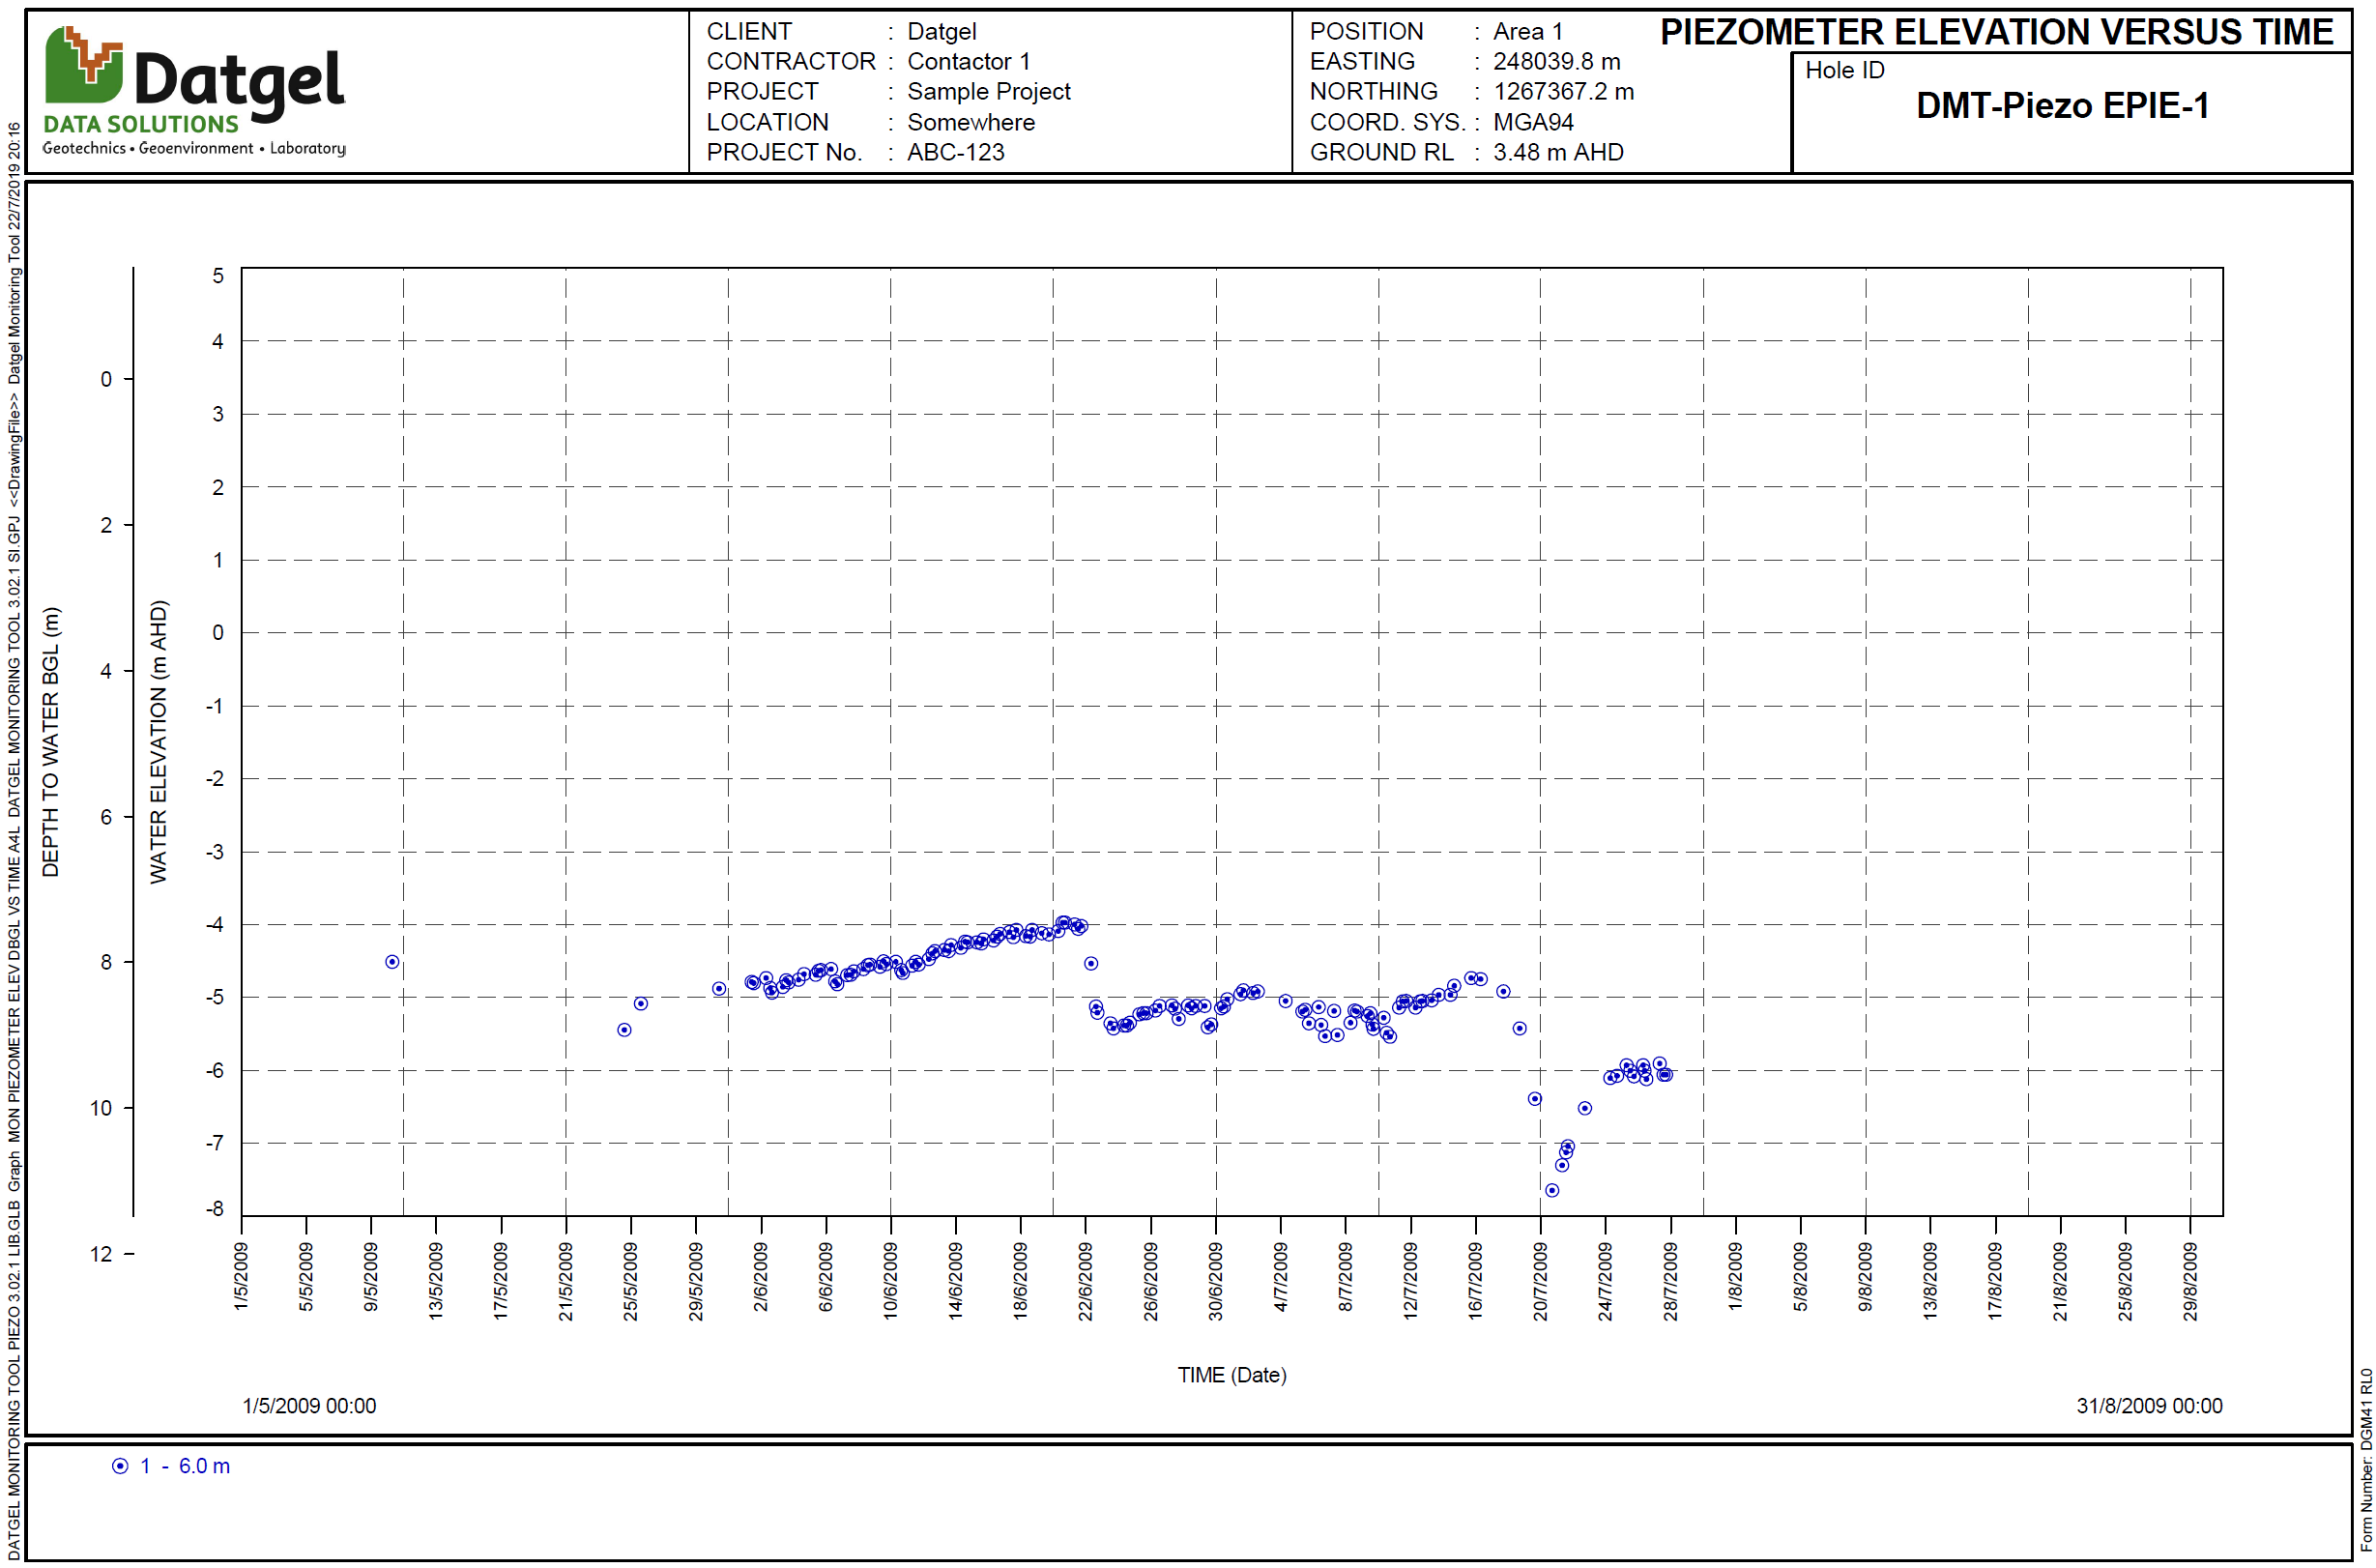
The following example explains how to output a piezometer report, including the installation log and the data graphs.
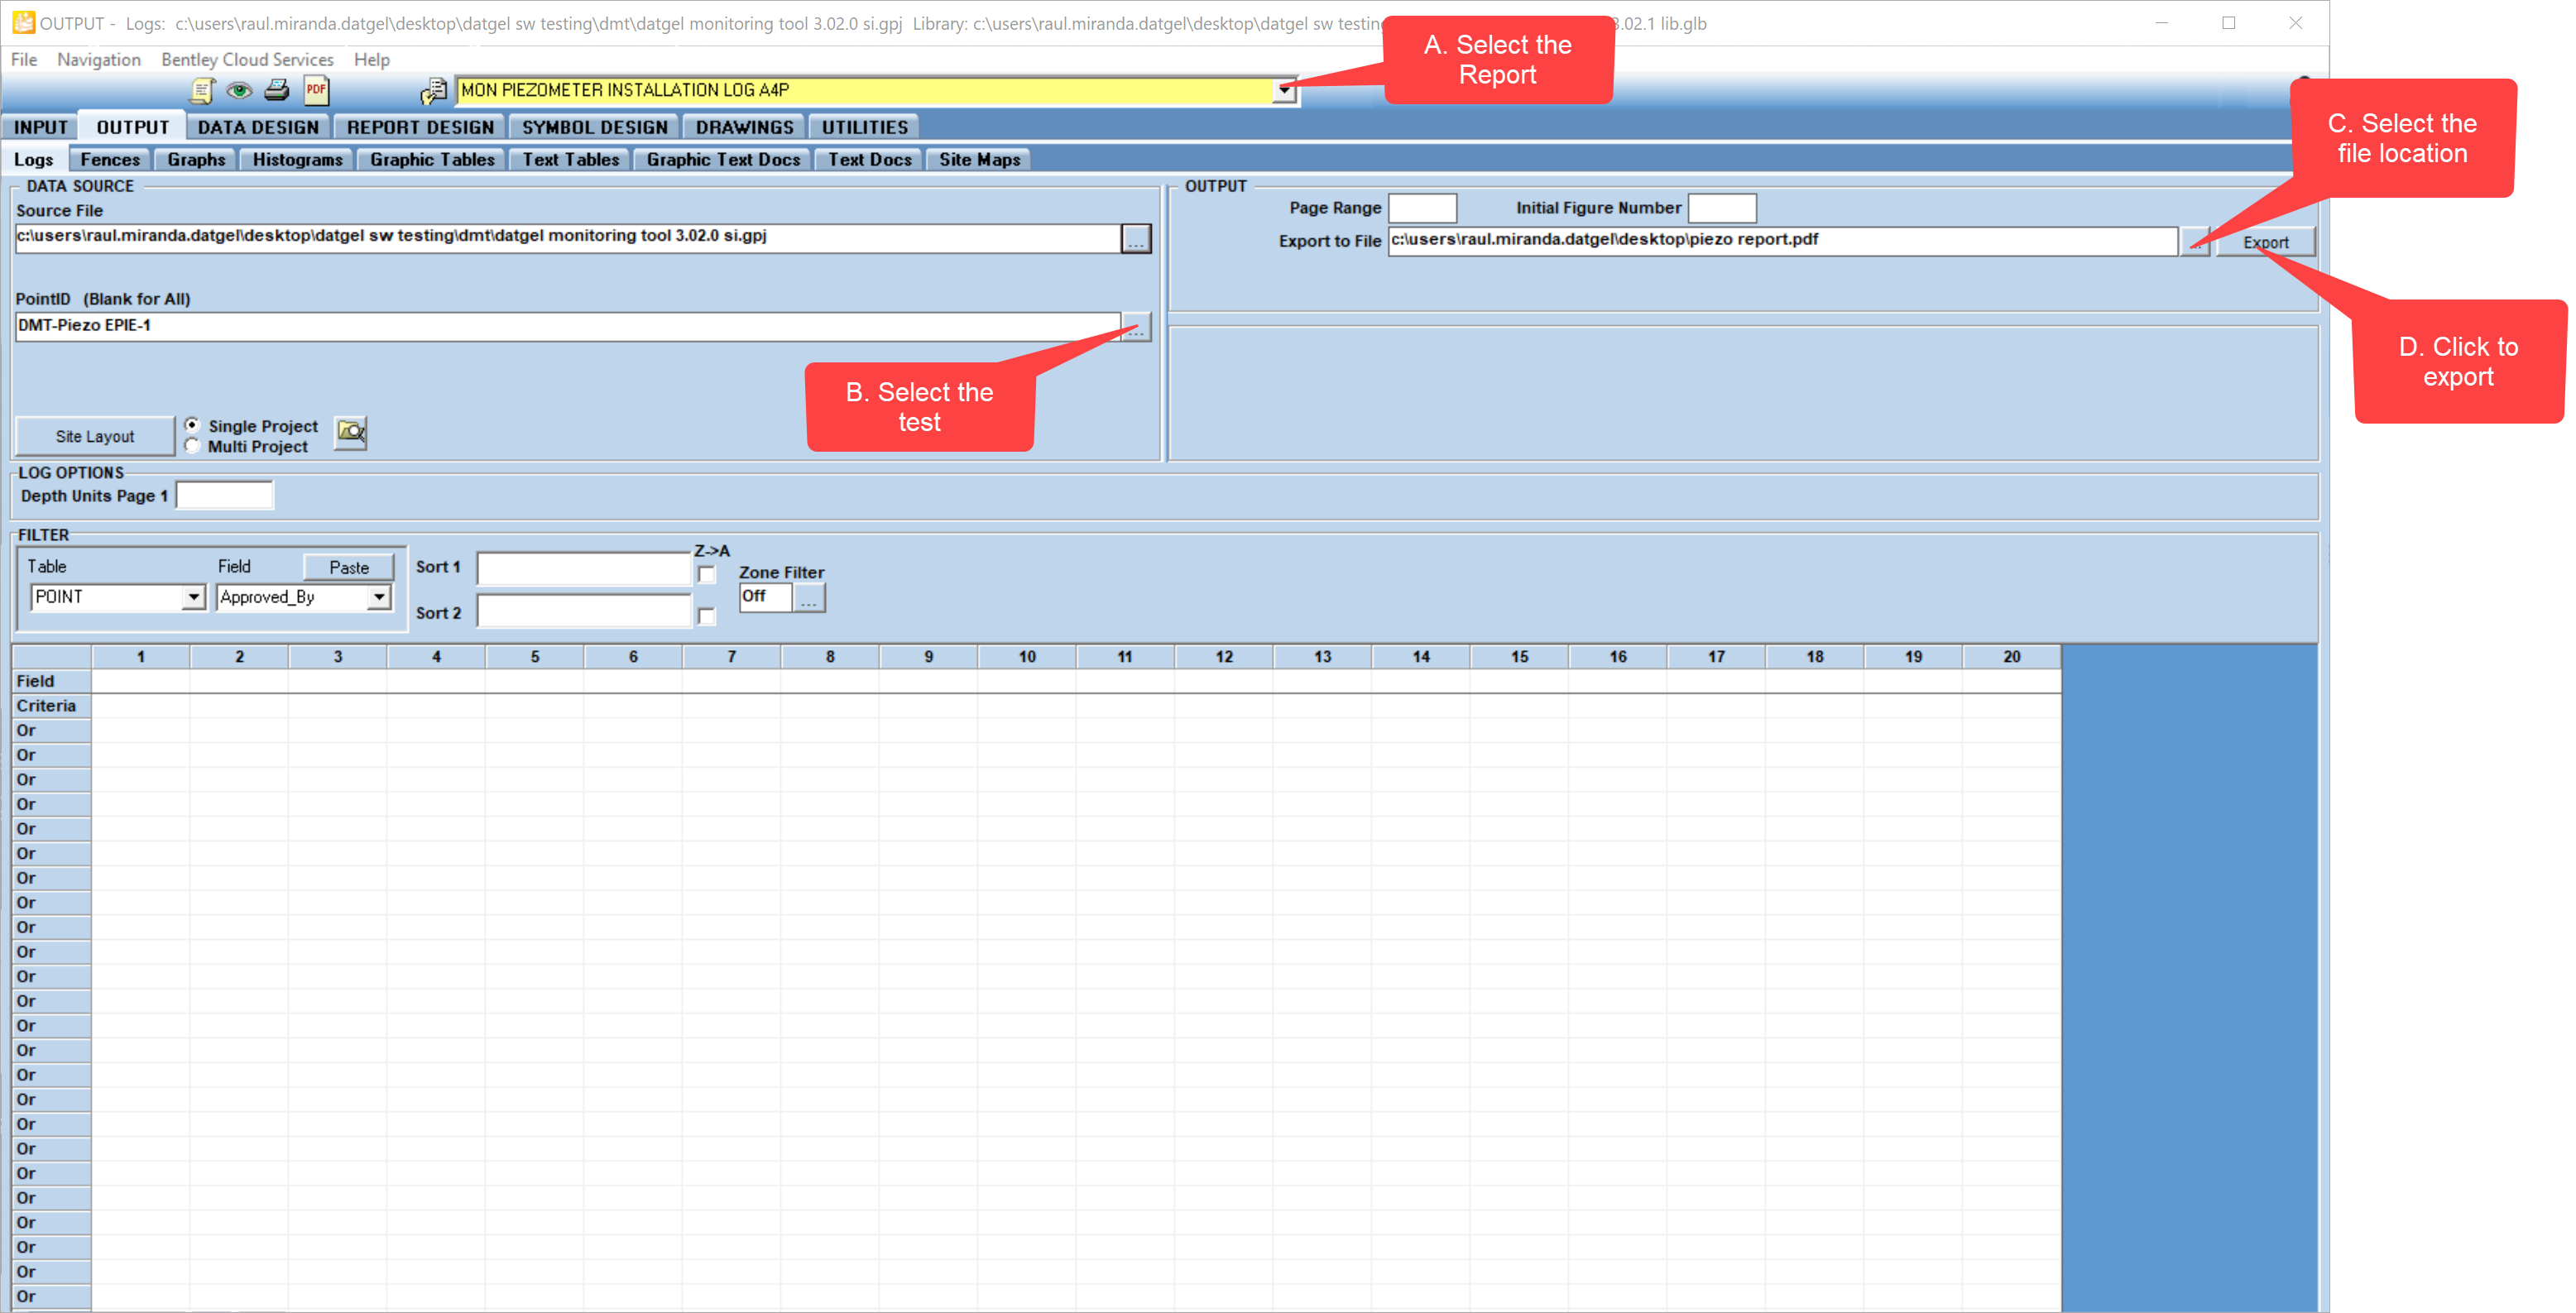
- Go to OUTPUT | Graphs.
- Select the MON PIEZOMETER INSTALLATION LOG A4P report from the yellow drop-down list.
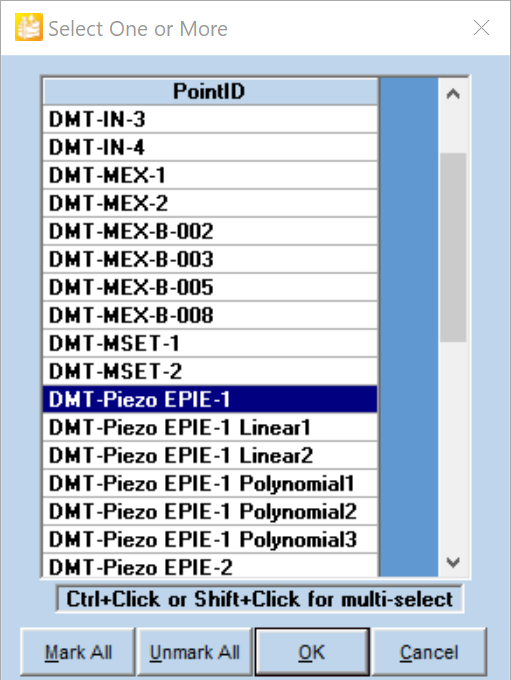
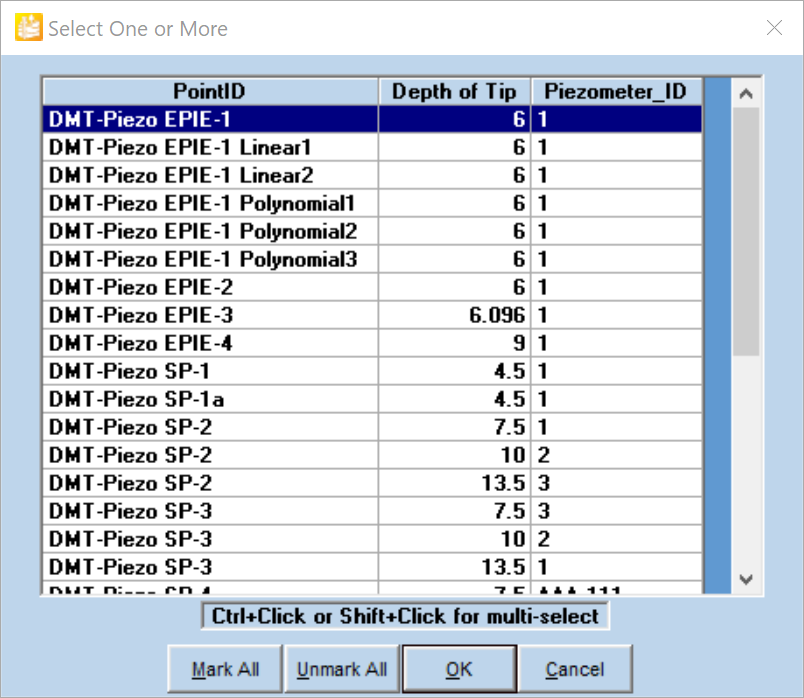
- Select the desired test from the KeySet picker: Click on the button and select the desired boreholes.
- Click on the button and choose the name for the new pdf document. choose the location and click Save. Choose resolution 600 dpi.
- Click Export and review the report.
- Go to OUTPUT | Graphs
- Select the MON PIEZOMETER ELEV DBGL VS TIME A4L report form the yellow drop-down list.
- The KeySet picker is empty. Select the test DMT-Piezo EPIE-1.
- The Export to File field shows the latest location. Choose the same file as the previous step.
- Check the box for View document after export.
- Review the pdf, it will have both reports.
- Alternatively, click the button to preview the report. You can review next page using the yellow drop-down list or press F6 button.
