CBR
Supported Test Methods
Standard | Description |
|---|---|
ASTM D 1883-07e2 | CBR (California Bearing Ratio) of laboratory compacted soils |
BS1377-4:1990:7 | Determination of California Bearing Ratio (CBR) |
Input
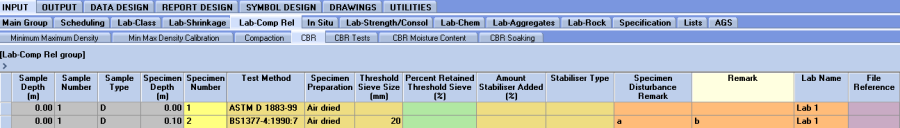
Lab-Comp Rel | CBR
To calculate the CBR Values of a specimen, you must first select the standard from the Test_Method and set Force_Stress_Units on the CBR table that the specimen is being tested against. Once selected, the necessary data entry fields will be automatically highlighted to assist you in entering the relevant data in the CBR Tests table for the selected test method.
On the CBR Tests (upper) table for each stage, define the preparation method used and the associated parameters, including Force Gauge Calibration (kN or psi/div) and Penetration Piston Diameter (mm or in). When you move to the CBR Tests (lower) table or select save, the Cross_Section_Area and Mould_Volume fields will be calculated.
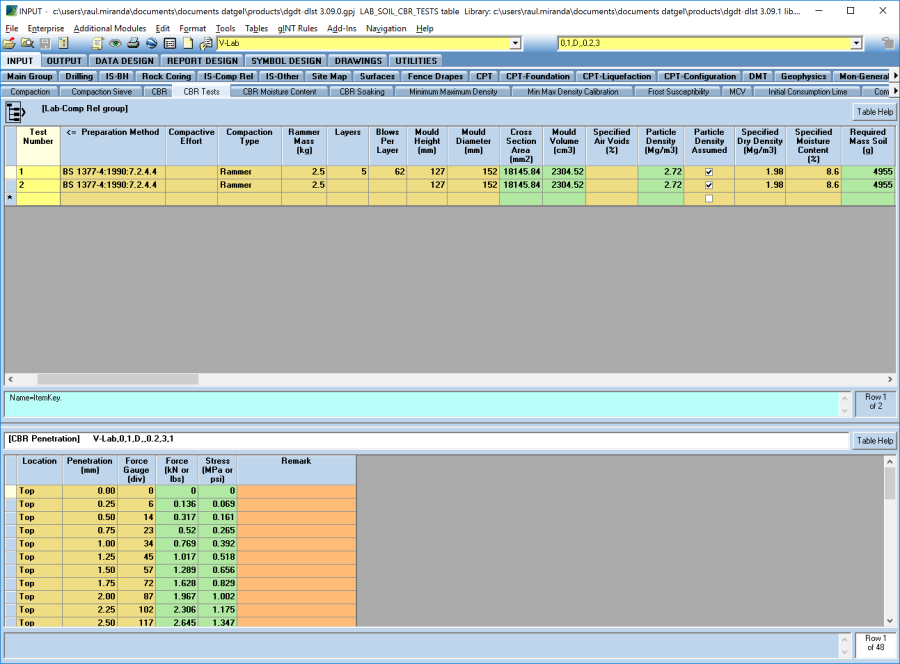
If a particle density test has been recorded on the Particle_Density / Specific_Gravity Table for the current specimen being tested, then that particle density result will be written to the Particle_Density field on the CBR_Tests table. If however you want to enter an assumed particle density value, check the box in the Particle Density Assumed field and enter the assumed particle density value in the Particle_Density field.
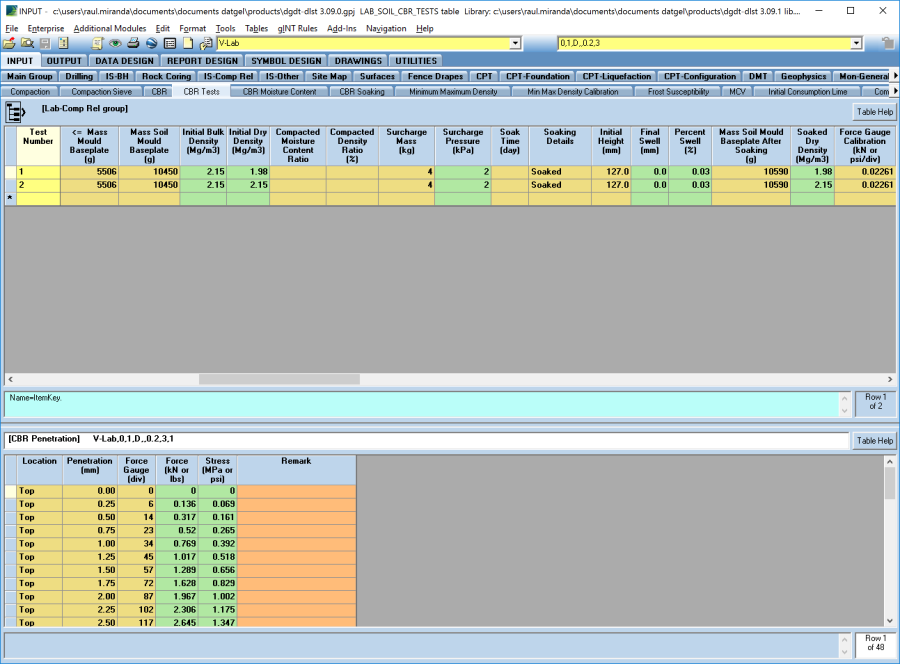
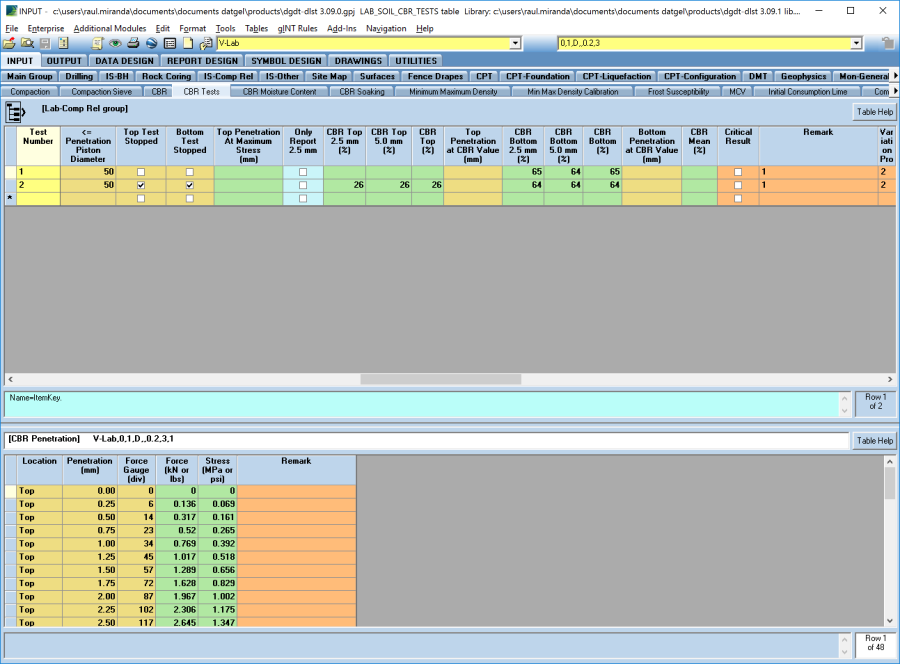
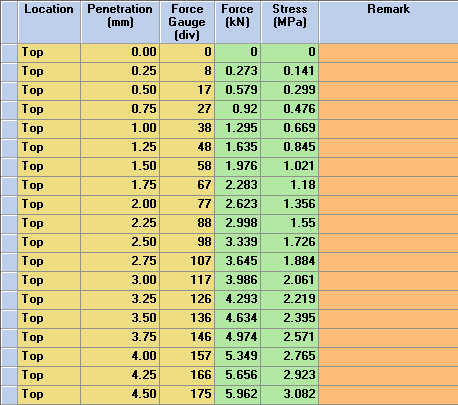
Enter the CBR test data in the data entry fields on the CBR_Tests (lower) table for each penetration test and when you change table or select save, the values will be calculated automatically and the result will be displayed in the calculated fields.
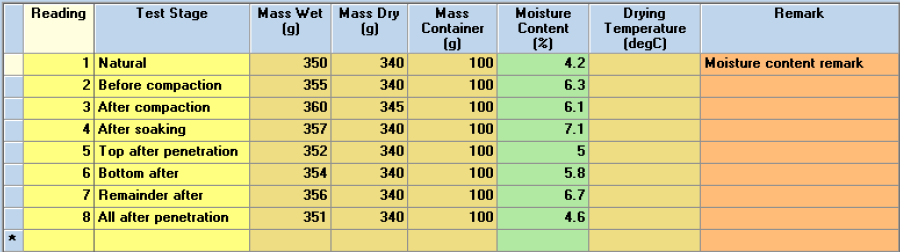
CBR Moisture Content Calculations
Select the CBR Moisture_Content table to storage and calculate the moisture content values determined in for each CBR test.
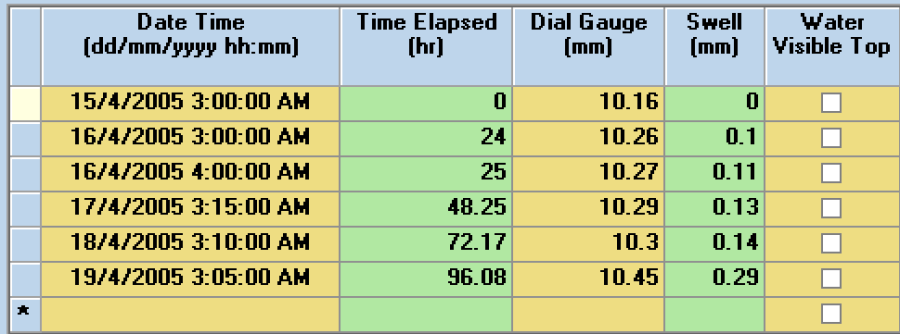
CBR Soaking
Select the CBR_Soaking table to storage and calculate the swell values determined in for each CBR test.
CBR Penetration Calculations
To determine the CBR values from the CBR chart, select Add-Ins > Datgel Lab Tool > CBR Graph to launch the CBR plot based on the recorded test data.
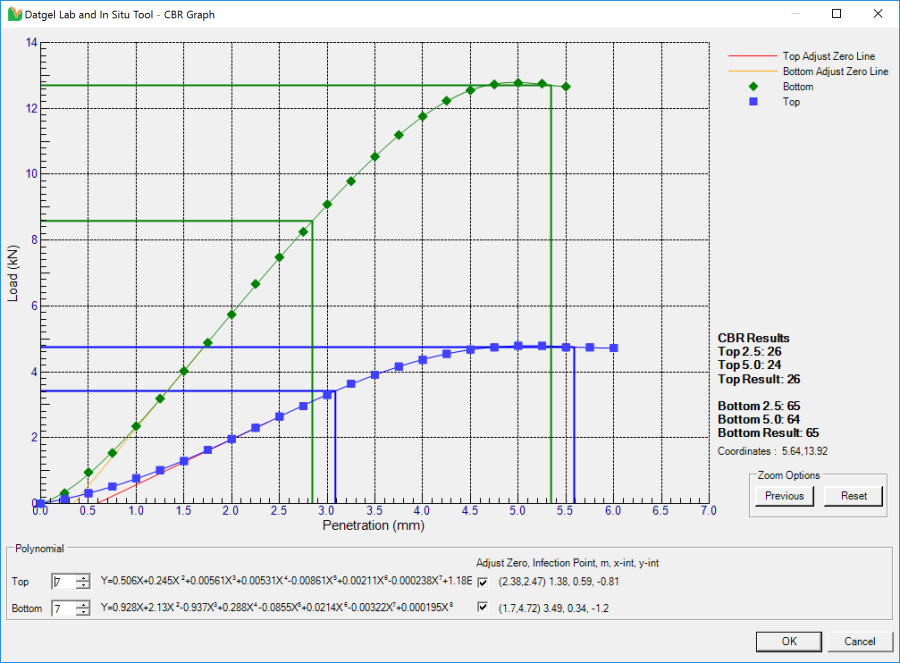
The initial plot displayed by the Datgel Lab Tool is based on the test data entered into you gINT database and can be manually refined should it be necessary.
To zoom in to an area of interest on the plot, you need to draw a window around the area that you wish to zoom into. To draw the window, move the mouse pointer to a position on the plot that you want to define as a corner of the zoom window and whilst holding the left mouse button down, move the mouse pointer to define the zoom window. When you release the left mouse button, the view will zoom into the area you have just defined.
To return to the previous view select the Previous button and to revert to the initial plot view select Reset.
The polynomial order of the equation can be increased or decreased by clicking on the up or down arrow for the Polynomial Order box.
If you are satisfied with the defined CBR Results, click Ok and you will be returned to the gINT Input screen and you will see that have been populated based on the curve. The equation, polynomial order and the coefficients of the curve are written to a field for future reference.
If you are not satisfied with the defined compaction curve, click Cancel.
Output
- Graph Report | L CR CBR PENETRATION
- Graph Report | L CR CBR PENETRATION MULTI
- Graph Report | L CR CBR SWELLING
- Graph Report | L CR CBR VERSUS DRY DENSITY
- Histogram Report | A L CR CBR