Compaction
Supported Test Methods
Standard | Description |
|---|---|
ASTM D 1557-07 | Laboratory compaction characteristics of soil using modified effort |
BS1377-4:1990:3 | Determination of dry density/moisture content relationship |
Input
Lab-Comp Rel | Compaction
To calculate the particle size distribution of a specimen, you must first select the standard from the Test_Method field on the Compaction (upper) table that the specimen is being tested against. Once selected, the necessary data entry fields will be automatically highlighted to assist you in entering the relevant data in the Compaction (upper) table for the selected test method.
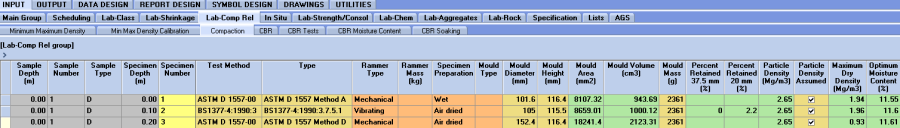
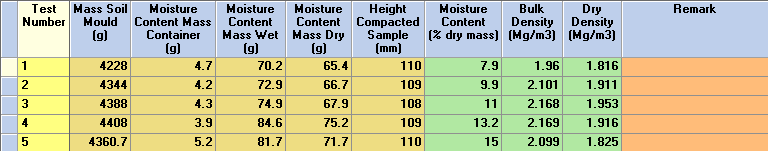
Enter the test data in the data entry fields on the Compaction (lower) table for each test and when you change table or select save, the values will be calculated automatically and the result will be displayed in the calculated fields. The Bulk_Density field on the Compaction (lower) table will be calculated by the following equation for the ASTM D 1557-00 method or for the BS1377-4:1990:3 methods:
ρ=(m2- m1)/V
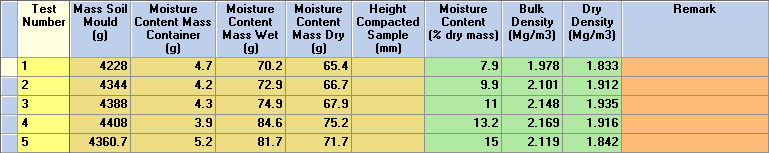
If the height of a compacted sample is recorded the Bulk_Density field on the Compaction (lower) table will be calculated by the following equation for the ASTM D 1557-00 method or for the BS1377-4:1990:3 method: ρ= ((m2-m1)/Ah)*1000
If a particle density test has been recorded on the Particle_Density / Specific_Gravity Table for the current specimen being tested, then that particle density result will be written to the Particle_Density field on the Compaction table. If however you want to enter an assumed particle density value, check the box in the Particle_Density_Assumed field and enter the assumed particle density value in the Particle_Density field.
Maximum Dry Density & Optimum Moisture Content
To determine the maximum dry density value from the compaction plot, select Add-Ins > Datgel Lab Tool > Compaction Graph to launch the compaction curve plot based on the recorded test data.
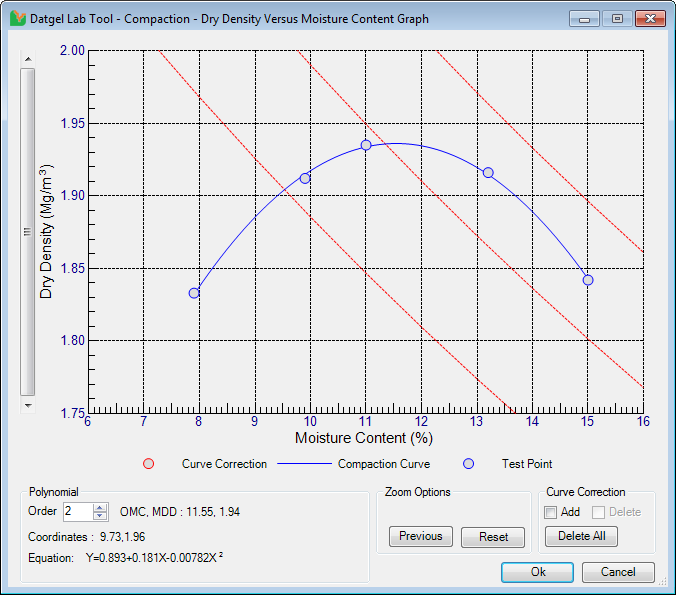
The initial plot displayed by the Datgel Lab Tool is based on the test data entered into you gINT database and can be manually refined should it be necessary.
To zoom in to an area of interest on the plot, you need to draw a window around the area that you wish to zoom into. To draw the window, move the mouse pointer to a position on the plot that you want to define as a corner of the zoom window and whilst holding the left mouse button down, move the mouse pointer to define the zoom window. When you release the left mouse button, the view will zoom into the area you have just defined.
To return to the previous view select the Previous button and to revert to the initial plot view select Reset.
The polynomial order of the equation can be increased or decreased by clicking on the up or down arrow for the Polynomial Order box.
Sometimes the automatically fitted curve will have curls and extreme curves, as shown in the next figure – Example Uncorrected Compaction Curve Plot.
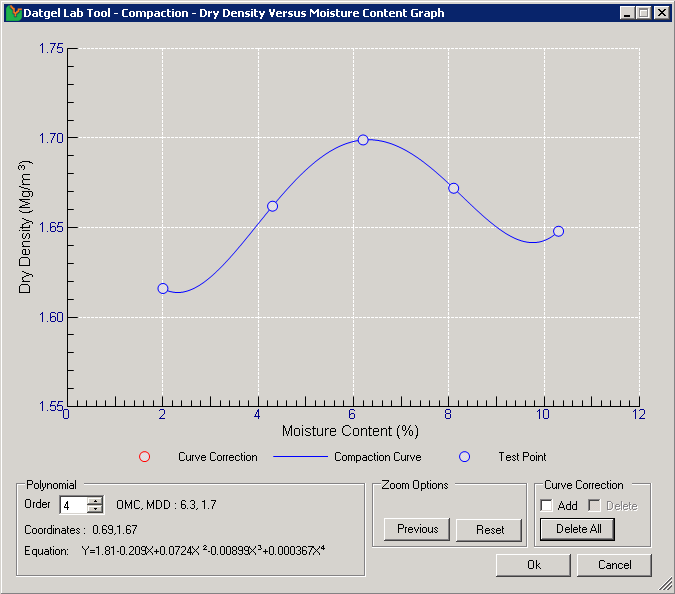
To remedy this, you can add Curve Correction points by first checking the Add check box, and then clicking on the graph in the required location. We have found that tracing the required curve with Correction Points, and then increasing the Polynomial Order is often successful.
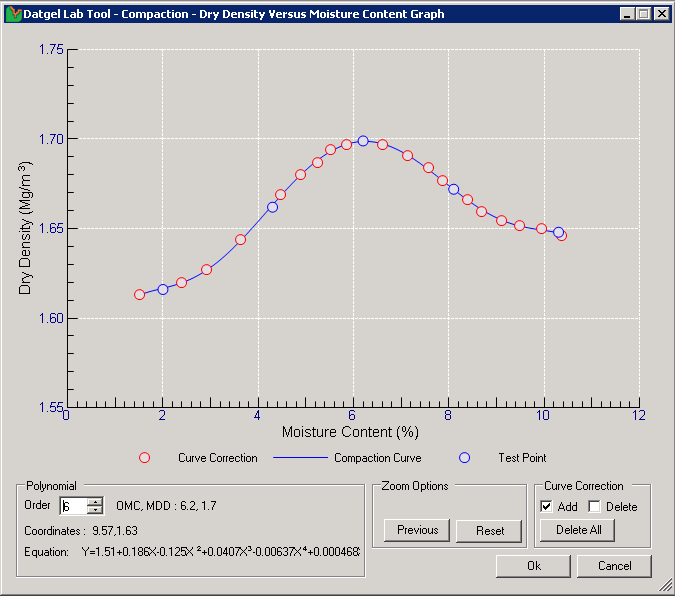
To remove an individually added Curve Correction point, check the Delete box and select the point that you wish to delete. To remove all the Curve Correction points, select the Delete All button.
If you are satisfied with the defined compaction curve, click Ok and you will be returned to the gINT Input screen and you will see that the Maximum_Dry_Density and Optimum_Moisture_Content fields have been populated based on the compaction curve graph. The equation, polynomial order and the coefficients of the curve are written to the Curve_Formula, Curve_Order and the Curve_Coefficients fields for future reference.
If you are not satisfied with the defined compaction curve, click Cancel.
Output
- Graph Report | L CR COMPACTION