How to display solid colour behind legend graphic
The Fence and Map Tool allows you to print the material graphic with a solid colour behind it defined by a geology unit. This tutorial shows how to do it.
Step-by-step guide
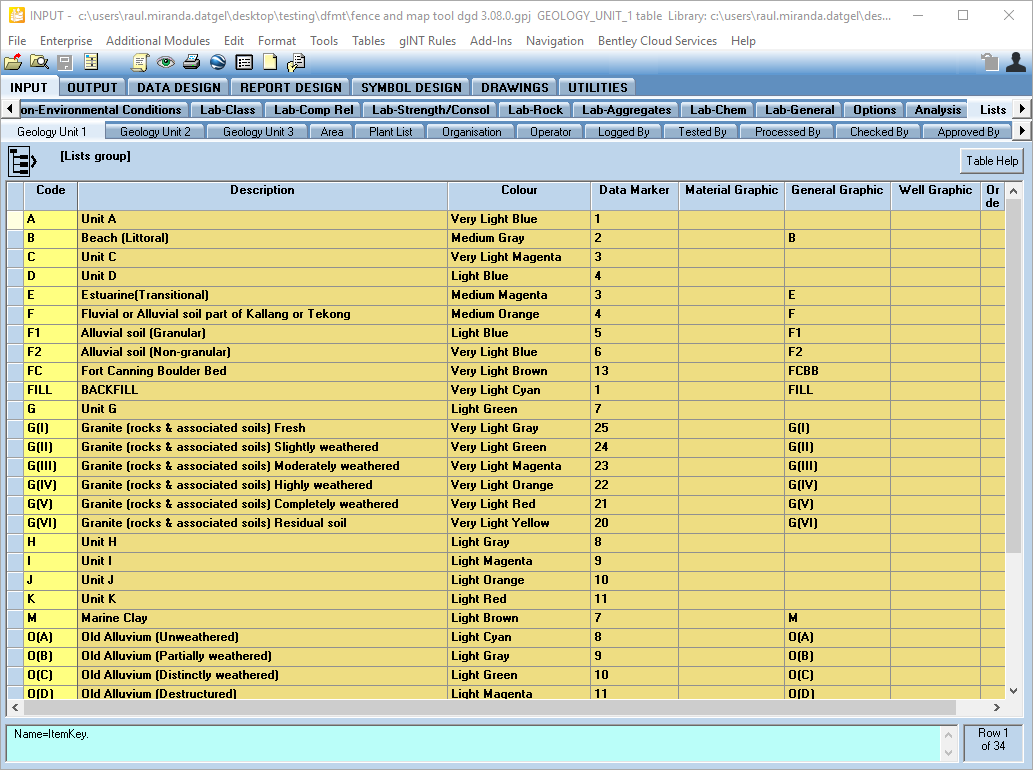
First, you need to populate the geological unit with the geology units you have in your project, area, etc. There are 3 tables to store geology units.
Populate the code and the description and assign a colour and a data marker. The following figure shows the information stored in the Geology Unit 1 table in the example data provided by Datgel in the tool package. You may consider use this data or add and remove items according to your needs.
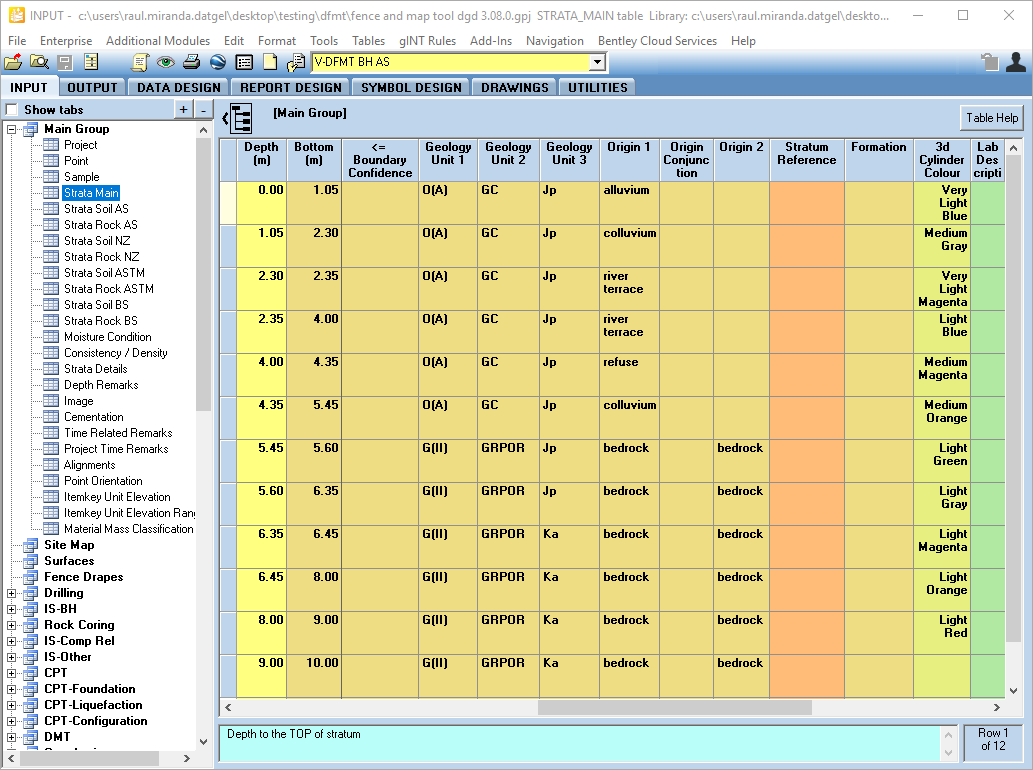
Then go to Strata Main table. The column Geology Unit 1, Geology Unit 2 and Geology Unit 3 will show in the drop down list the information stored in the previous step.
For each row, select a geology unit. See next figure as an example.
Once you entered all the required information, move to Output tab, select a fence report, select the point you want to print and click on Preview button.
In the User Report Variables window, select Stick = L GU1
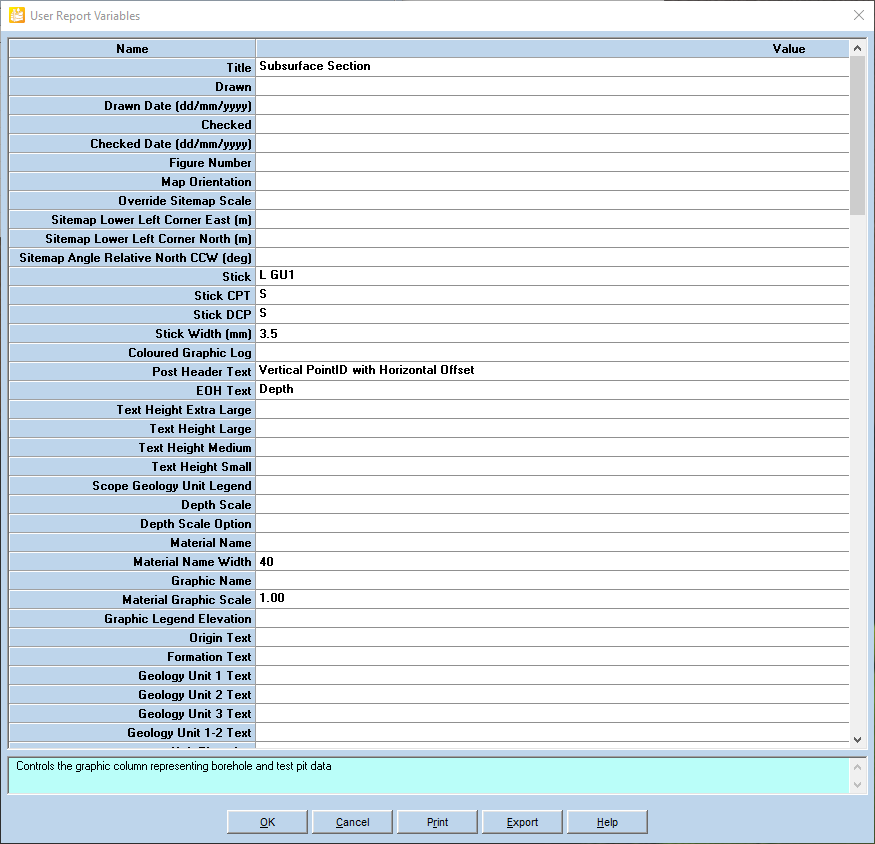
Click OK.
The result is the stick with the material graphic coloured by the geology unit colour.
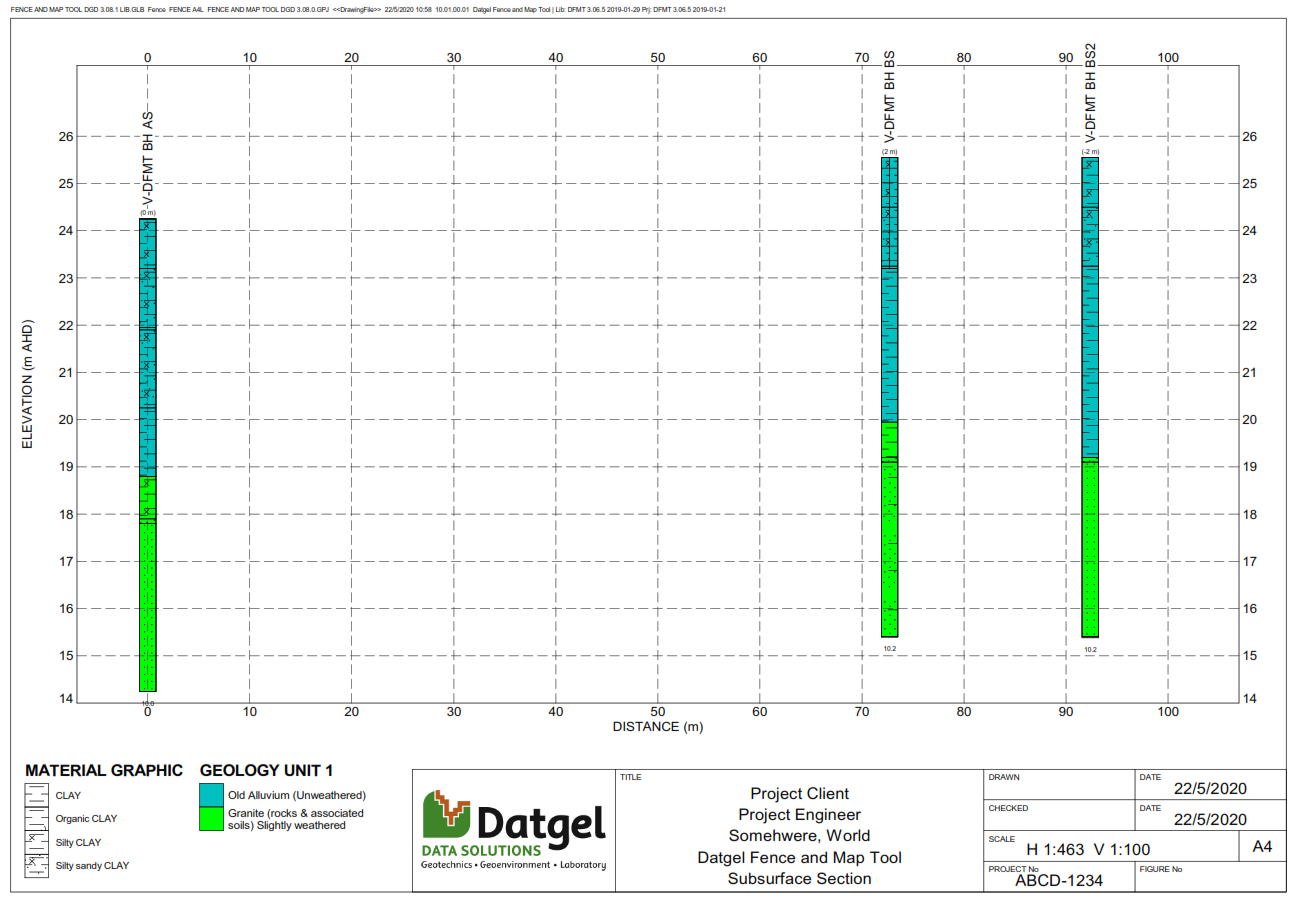
Note you may print also Geology Unit 2 and 3 in the same way, by choosing the relevant User Report Variable.
Related articles
-
How to change default values of user report variables (Fence and Map Tool)
-