Set scales on reports
How can I set the maximum scale of the plot for qc or another parameter?
Step-by-step guide
This can be done at the Point level, Project level and Library level hence the library is default.
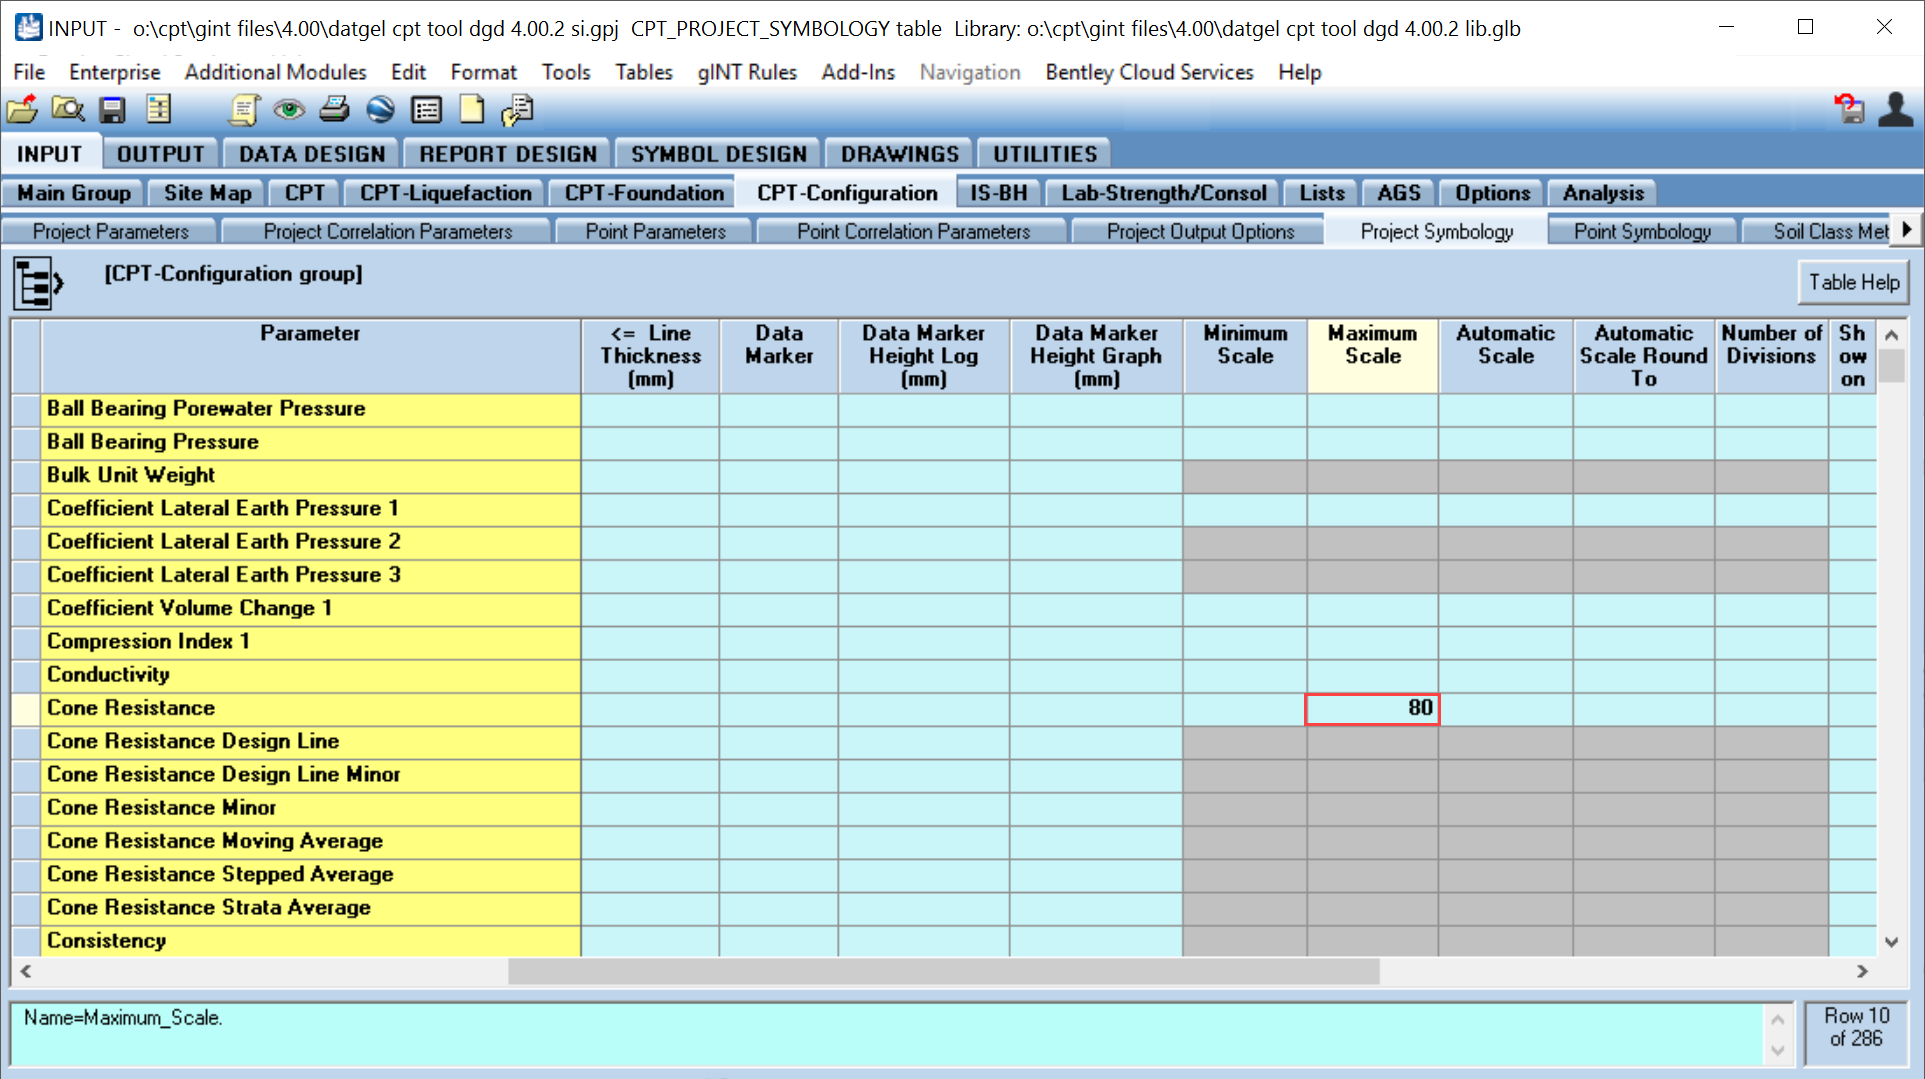
The most common need is to set it for the current project, this is done in the table INPUT | CPT-Configuration | Project Symbology, the the Maximum Scale field. Where multiple parameters need to plot on one graph, we don't let you set multiple maximum values for related parameters.
For more information see Report Symbology.
Related articles
Content by label
There is no content with the specified labels
